Parity progression ratios
Introduction
When women or parents think about childbearing they usually think in terms of starting a family, or increasing their family by adding another child. This section focuses on analyzing the incremental aspects of childbearing, looking at proportions of mothers who reach a given parity or birth order, and the proportion who then proceed to increase their parity by at least one more child.
Information on birth order is easily obtainable from two basic census questions: on women’s completed parity and on births in the past year. Using the first question one can disaggregate the births in the past year by birth order. Examination of fertility data by parity through the use of parity progression ratios and their projected equivalents gives additional information on childbearing trends and can be used to assess changes in the parity distribution of fertility.
This section describes the procedure for calculating parity distributions and parity progression ratios for women who have reached the end of childbearing as well as the derivation of projected parity progression ratios to forecast the eventual distribution of younger women by the parities that they are expected to attain when they reach the end of childbearing.
Parity progression ratios (albeit with somewhat different notation) are well described in the demographic literature (see, for example, Preston, Heuveline and Guillot (2001)). The idea of calculating projected parity progression ratios proposed by Brass (1985) is less widely known. The exposition here focuses on the calculation of the latter quantities, although conventional parity progression ratios are required as part of the process and are described as well.
A parity progression ratio (PPR) is the proportion of women who progress from one parity to the next. PPRs can be calculated for cohorts of women defined either by age or marriage. Usually age cohorts of women are considered i.e. the parity progression ratios are calculated from the parity distribution of a particular age group of women. For cohorts of women that have finished childbearing, and assuming there is no differential mortality by parity of older women, these measures are fixed. For cohorts that are still in the childbearing ages, however, the measures change as increasing numbers of women move to higher parities. The measures derived from younger women thus suffer from both censoring and selection effects as women predisposed to having more children faster will be disproportionately represented in age-parity combinations before the end of childbearing. This means that comparison of the PPRs of younger and older women is misleading.
Brass (1985) describes a technique for projecting PPRs to the end of women’s reproductive years that enables one to use the parity data on younger women. The advantage of disaggregating fertility by parity is that different PPRs may respond to different factors, so that changes in particular PPRs may provide insight into processes of fertility change going on in the population. Thus, for example, parity-specific fertility limitation (or its absence) is readily measured by parity progression ratios. PPRs may also be less affected than more common fertility metrics by some types of data error (e.g. reference period errors). The calculation of first birth rates, carried out in the construction of projected PPRs, can also provide an indication of data quality and fertility change.
The calculation of PPRs for cohorts that have completed their fertility is straightforward. Comparison of successive cohorts can give information on trends in fertility, although more reliable conclusions can be drawn if PPRs for the same cohorts can be compared across more than one census. For younger women, who provide information on more recent fertility trends, a more elaborate procedure is required. These rates are used to project the expected parity distribution that the younger women would achieve if they experienced the age-order specific fertility rates (AOSFRs) until the end of childbearing. This parity distribution is used to calculate projected PPRs, which can be used to infer changes in fertility that are implicit in women’s childbearing histories to date combined with the current AOSFRs. An advantage of using the projected PPRs is that, since they are ratios, errors in the AOSFRs that result from under-reporting will tend to cancel out when they are used to project PPRs, with the exception of progression from nulliparity to the first birth.
Two new concepts are introduced. The first is M(i) the proportion ever-attaining parity order i, which is the proportion of women who have at least i children. The second is a(i), the parity progression ratio, which measures the proportion of women who progress from a given parity, i, to the next parity, i + 1. Projected proportions attaining parity i, M*(i) and projected parity progression ratios a*(i) respectively denote the proportions of women who are expected to attain at least parity i, and who are expected to progress from parity i to parity i + 1 by the end of their childbearing years.
Estimates obtained
The following measures can be calculated specifically for any age group of women:
- The observed proportion ever-attaining parity order i, 5Mx(i), is the proportion of women aged x to x + 5 who have had i or more births. The corresponding projected proportion,, is the proportion of women currently aged x to x + 5 who are expected to have had i or more births by the end of their reproductive lives. After the end of childbearing, for x≥50, the observed and expected proportions are identical.
- Observed parity progression ratios of order i for women aged x to x + 5 are denoted to represent the proportion of women with at least i children who have progressed to have at least one more subsequent birth. Projected parity progression ratios are denoted by . Once again, for x ≥ 50 observed and expected ratios are identical.
The following identities link these measures, and relate them to the distribution of women by parity.
Define N(i) to be the number of women in the population of parity i exactly, and denote the total number of women in the population as N.
Let W(i) be the number of women in the population having attained parity i or higher, and denote the highest parity attained in the population by .
The number who have attained parity i or higher is obtained by summing higher order N(i):
so that the corresponding proportion, M(i), is
The number of women of parity zero and over is
so that the proportion at parity zero and over, M(0) = N/N = 1.
The average parity, P, in the whole population is
For women who have completed childbearing, average parity is the same as completed family size, CFS, the equivalent of Total Fertility in a real cohort:
for x ≥ 50.
The parity progression ratios can be written in terms of numbers or proportions:
Conversely, the proportion of women attaining parity i+1 or higher can be expressed in terms of parity progression ratios a(i) for lower birth-order transitions:
where the symbol denotes cumulative multiplication.
Data requirements and assumptions
Tabulations of data required
a) Observed party progression ratios
- Parity by age group of women aged 45-49 or more
b) Projected parity progression ratios
- Parity by age group of women aged 45-49 or less, and
- Number of children born during the year preceding the census, classified by mothers’ age (in five-year groups) and number of children ever born. Given the assumptions described below, exact apportionment of births in the last year is not called for. Use of births in each of the 12 complete months preceding the census date is recommended.
Important assumptions
- Women have had at most one birth in the past year.
- The AOSFRs derived will continue to apply in the future. This assumption may be unrealistic. It indicates that projected PPRs measure the implications of women’s achieved fertility in combination with current AOSFRs. The PPRs should not be treated as forecasts for cohorts likely to have a considerable number of additional children of the parity concerned, or where fertility is changing rapidly.
Preparatory work and preliminary investigations
Before commencing analysis of fertility levels using this method, analysts should investigate the quality of the data at least in respect of the following dimensions:
- age and sex structure of the population;
- reported births in the last year; and
- average parities and the necessity of an el-Badry correction.
Caveats and warnings
- Where appropriate and necessary, the parities should be those estimated by means of the application of the el-Badry correction for the misreporting of childless women as parity not stated.
- If sample or design weights have been provided with the data, remember to apply them in the manner appropriate to the statistical software used when deriving the tabulations used as inputs.
- Projected PPRs should only be calculated from censuses and other data sets that include a large number of women (at least 10,000 in each age group) because the derivation of reliable age-order-specific fertility rates (which are required to derive the projected parity progression ratio) requires robust estimates of the rates at each age and parity combination.
Application of method
The calculation of projected PPRs involves a number of steps, but the principle behind the calculation is not difficult to grasp. The AOSFRs that are calculated using the births in the previous year are used to project forwards the parity distribution that would be expected for each cohort if those rates were to continue for the rest of the cohort's childbearing. This is done by calculating the order-specific equivalent of total fertility, that is, the cumulated fertility rates for births of the i-th order, cumulated across all age groups. These rates are used to calculate the additional births of order i expected to be added to each age cohort of women in the interval from their current age to the end of their reproductive span. This is a synthetic cohort measure since it cumulates current period rates. The additional proportion expected to reach parity n or more is added to the current proportion of women of birth order i or more, to give the final proportion expected to be of parity i or more. These cumulated projected parity distributions are used to calculate projected PPRs, which can be examined for fertility trends. Symbolically, and defining 5Px to be the average parity of women aged between x and x + 5, the projected completed cohort fertility of women aged x to x + 5 is thus
Step 1: Extract a tabulation of children ever born by age group of mother for each age group for which there are data
Tabulate the number of women in each age group [x,x + 5), , by number of children ever born, i, to produce a series . If necessary, the data should have been edited to eliminate implausible parities. An el-Badry correction should have been applied if this is indicated.
Step 2: Extract a tabulation showing the number of births in the last year, by mother’s age and parity
The assumption is made at this stage that women have had a maximum of one child in the last 12 months, and that there have been neither multiple deliveries nor multiple confinements in the period. It follows that an implicit assumption is that a birth in the last year to a woman currently of parity i was a birth of order i.
Step 3: Derive proportions ever attaining parity i and parity progression ratios for each age group
The number of women aged between x and x + 5 who have given birth to i or more children is thus given by
The proportions of all women aged [x,x + 5) who have had i or more births are calculated as
Proportions with i or more births should be derived for all cohorts, whether or not they have finished their childbearing. Women of zero parity should be included in the denominator, but those of unknown parity (after the application of an el-Badry correction, if necessary) should not.
The Parity Progression Ratio (PPR) between parity i and i+1 is then defined as
Derivation of parity progression ratios for women who have completed childbearing ends with this step. The following steps describe how to derive projected parity progression ratios for younger age cohorts of women.
Step 4: Derive age-order specific fertility rates
From the tabulation of births in the last year by age group and parity of mother (in Step 2), calculate age-order specific fertility rates for women in each age group 15-19, … 45-49,
.
Again, women of unstated parity should be excluded from the denominator. (Note that since the denominator is the total number of women in the age group (5Nx), and hence not a measure of exposure to risk of generating the events in the numerator, the AOSFRs are not true incidence rates).
Step 5: Derive cumulated order-specific fertility rates
Cumulated age-order specific fertility rates up to age x+5 for order i are calculated from
It follows that is a measure of the additional proportion of women expected to achieve parity i between age x + 5 and the end of the reproductive period, on the assumption that future fertility will remain the same as current fertility.
Step 6: Calculate the age distribution of order-specific fertility rates, and interpolate to conventional ages
The cumulated rates derived in the previous step apply to ages 19.5, 24.5, etc. (the half-year shift being on account of the classification of mother’s age being age at the census date, and not her age at the birth of the child). The proportions ever attaining each parity and parity progression ratios, on the other hand, apply (roughly) to the mid-point of each age group 17.5, 22.5, etc. The age-order rates must therefore be interpolated so that they apply to the central age of each age group. Interpolation is carried out by expressing the cumulated age-order fertility rates as proportions of the total order-specific rates and using linear interpolation on the gompits of the cumulants.
For each birth order, calculate the proportion of the total order-specific rate achieved by the upper limit of the age group. Since rates for shifted age groups have been used in this example, the upper limits are shifted down by half a year. The proportions are calculated by summing the rates up to the upper limit of the age group, and expressing this summation as a proportion of the total rate i.e.
As already noted, these proportions apply to ages 19½, 24½, etc. Due to the curvature of the fertility schedule, direct linear interpolation to obtain the proportions at ages 22½, 27½ etc. is not appropriate. A gompit (double negative log) transform, however, transforms a sigmoidal function to a straight line. Hence, the gompits of the proportions are calculated, interpolated to the conventional mid-points, before being returned to their original scale by means of the application of the anti-gompit. Thus, using an asterisk to denote the shift to conventional midpoints
This can be applied for x = 20, 25,…, 40.
To avoid introducing too large a projected component into the projected parity progression ratios, we ignore in all future calculations those estimates of which indicate that the proportion of order-specific fertility attained by the mid-point of an age group is less than 0.3. We treat as somewhat speculative calculations based on values of .
Step 7: Calculate the expected future order increment
The additional proportion of women reaching each parity in the interval from the mid-point of the age group to the end of childbearing is given by
Step 8: Derive projected cumulated parity progression ratios and projected parity progression ratios
The projected cumulated parity progression ratios are calculated by adding the future order increments derived in the previous step to the current cumulated parity progression ratios calculated in Step 1. Thus the proportions of women aged x to x+5 projected to achieve at least parity i is given by
and the projected parity progression ratios between parity i and i + 1 is given by
Interpretation of results
The interpretation of changes in PPRs may be complicated by data errors and should take into account the assumptions underlying the calculations. To the extent that there are errors in the data, care should be taken to not over-interpret the results. PPRs with a substantial projected component must be interpreted with special care, since they may reflect period effects which will cease to apply in the future. If, for example, the AOSFRs reflect a delay in the timing of births around the time that the data are collected and fertility subsequently increases to compensate so that women catch up with the parities achieved by earlier cohorts, then the projected PPRs would be misleading. Equally, a future decline in fertility will reduce the final parities of women even if current rates predict no decline. The projected PPRs for older women are more reliable since they have a smaller projected proportion.
The projected first birth ratio, i.e. , is often biased by reference period errors which will not cancel out in the way that they will in the other PPRs. The projected proportions having at least one child will be affected by changes in the timing of entry into motherhood. Since the measure is a synthetic cohort measure derived from current rates, changes in the timing of first births will also affect the cumulated rate and may also make it fall outside the range expected for most real cohorts in developing countries. Short-term fluctuations and tempo effects might mean that the (period) first-birth ratio might occasionally exceed one. This should not be confused with, or interpreted as indicating, a parity progression ratio greater than one, which is definitionally impossible.
The projected first birth ratio may also give an indication of the quality of the data. These rates show the proportion of women expected to become mothers over their reproductive lifetime in a synthetic cohort experiencing these rates. Reference period errors may result in an unlikely projected proportion of women expected to become mothers. Extreme reference period errors might result in this proportion being greater than one. If the cumulated rates are less than 0.9, this is a strong indicator of errors in the data or substantial changes in the timing of first births, although lower proportions may be observed in historical populations with high levels of primary sterility and in contemporary, low-fertility, populations with high levels of voluntary childlessness. A rise in the (projected) proportion of women expected to become mothers, , has often been observed in populations which have seen a decline in primary sterility.
High-order PPRs may be subject to a large degree of fluctuation as a result of sampling errors in the AOSFRs, since they are derived from relatively small numbers of births. When large sampling errors are present in the data due to small numbers of women, it is acceptable to 'condense' or average two or more adjacent projected PPRs to see trends more clearly.
Examination of the trends in parity progression ratios across cohorts (projected for the 40-44 cohort and younger and actual for the 45-49 cohort and older) can cast further light on fertility trends. A decline in a (projected) PPR indicates a decline in the proportion of women progressing to the following birth and, all other things being equal, indicates declining fertility. Changes in the PPRs at different parities may result from various factors, with some ratios being affected more than others. Which PPRs change may be a useful guide to fertility changes in the population. For example, the spread of family limitation through parity-specific contraception will be reflected in the decline of PPRs of middle-order parities (say, 3 to 6). A change in higher-order PPRs often reflects parity-independent fertility changes, such as a change in the duration of breast feeding.
Worked example
The example analyses data from the 1998 Cambodia Census, which was conducted on 3 March 1998. The method has been implemented in an accompanying Excel workbook.
Step 1: Extract a tabulation of children ever born by age group of mother for each age group with data
The data from the census, uncorrected, are shown in Table 1.
Table 1 Number of women by age group and parity, Cambodia, 1998 Census
Age group | ||||||||||
|---|---|---|---|---|---|---|---|---|---|---|
| Parity (i) | 15-19 | 20-24 | 25-29 | 30-34 | 35-39 | 40-44 | 45-49 | 50-54 | 55-59 | 60-64 |
0 | 635,940 | 200,620 | 105,350 | 55,300 | 33,900 | 22,970 | 16,430 | 9,790 | 7,640 | 6,880 |
1 | 30,340 | 94,810 | 79,570 | 38,780 | 21,150 | 16,570 | 13,460 | 9,600 | 8,020 | 7,450 |
2 | 5,980 | 62,580 | 113,640 | 66,750 | 33,320 | 21,920 | 17,220 | 12,840 | 9,690 | 8,020 |
3 | 1,650 | 21,680 | 88,750 | 75,660 | 45,680 | 27,750 | 20,250 | 15,170 | 11,180 | 8,120 |
4 | 1,200 | 6,890 | 44,480 | 72,370 | 56,100 | 35,450 | 24,530 | 18,090 | 13,350 | 10,160 |
5 | 630 | 2,060 | 16,580 | 51,600 | 57,050 | 39,100 | 26,660 | 19,660 | 16,100 | 12,040 |
6 | 0 | 1,120 | 5,630 | 30,250 | 50,960 | 39,180 | 27,540 | 19,860 | 16,180 | 12,250 |
7 | 0 | 510 | 2,110 | 13,390 | 35,780 | 33,190 | 25,850 | 18,880 | 16,170 | 13,690 |
8 | 0 | 480 | 1,070 | 5,970 | 20,580 | 24,920 | 23,180 | 16,940 | 14,830 | 11,970 |
9 | 0 | 0 | 440 | 1,820 | 9,590 | 15,860 | 16,130 | 12,680 | 11,360 | 9,200 |
10 | 0 | 0 | 240 | 880 | 4,840 | 10,420 | 12,790 | 10,720 | 9,800 | 7,750 |
11 | 0 | 0 | 120 | 320 | 1,760 | 4,430 | 6,670 | 5,370 | 4,850 | 3,970 |
12 | 0 | 0 | 80 | 150 | 760 | 3,220 | 5,350 | 4,810 | 4,780 | 4,230 |
13 | 0 | 0 | 40 | 60 | 250 | 990 | 1,960 | 1,790 | 1,790 | 1,440 |
14 | 0 | 0 | 0 | 40 | 170 | 620 | 1,020 | 970 | 760 | 540 |
15 | 0 | 0 | 0 | 10 | 10 | 250 | 510 | 460 | 440 | 490 |
16 | 0 | 0 | 0 | 10 | 30 | 130 | 230 | 160 | 140 | 210 |
17 | 0 | 0 | 0 | 0 | 10 | 40 | 80 | 50 | 70 | 70 |
18 | 0 | 0 | 0 | 10 | 10 | 30 | 30 | 30 | 40 | 40 |
| TOTAL | 675,740 | 390,750 | 458,100 | 413,370 | 371,950 | 297,040 | 239,890 | 177,870 | 147,190 | 118,520 |
Average parity | 0.082 | 0.862 | 1.965 | 3.150 | 4.369 | 5.086 | 5.566 | 5.758 | 5.974 | 5.969 |
The data show a typical pattern of average parities increasing with age up to the 45-49 age group. Thereafter, average parities increase by only a small amount. The data indicate, therefore, that either women older than 50 have omitted some of their children ever born, or that fertility was roughly constant among women finishing their childbearing in the last 10-15 years.
Step 2: Extract a tabulation showing the number of births in the last year, by mother’s age and parity
Data from the 1998 Cambodia Census on the number of births reported born in the year before the census, by mother’s age group and parity, are shown in Table 2.
Table 2 Births reported in the year before the census by mother’s age group and parity, Cambodia, 1998 Census
| Age group | ||||||
|---|---|---|---|---|---|---|---|
Parity (i) | 15-19 | 20-24 | 25-29 | 30-34 | 35-39 | 40-44 | 45-49 |
0 | |||||||
1 | 13,100 | 23,490 | 11,500 | 3,170 | 1,040 | 320 | 190 |
2 | 2,340 | 19,180 | 21,320 | 7,830 | 2,010 | 730 | 150 |
3 | 410 | 8,370 | 22,640 | 11,470 | 3,790 | 850 | 230 |
4 | 210 | 2,430 | 14,330 | 14,110 | 5,200 | 1,450 | 300 |
5 | 100 | 600 | 6,220 | 12,440 | 6,740 | 1,830 | 480 |
6 | 0 | 280 | 2,020 | 8,360 | 8,120 | 2,870 | 560 |
7 | 0 | 90 | 750 | 4,430 | 7,220 | 3,240 | 840 |
8 | 0 | 90 | 360 | 2,100 | 4,930 | 3,020 | 750 |
9 | 0 | 0 | 90 | 640 | 2,800 | 2,310 | 690 |
10 | 0 | 0 | 40 | 300 | 1,390 | 1,570 | 640 |
11 | 0 | 0 | 30 | 160 | 630 | 810 | 490 |
12 | 0 | 0 | 10 | 40 | 200 | 480 | 320 |
13 | 0 | 0 | 10 | 20 | 80 | 250 | 140 |
14 |
| 0 | 0 | 10 | 60 | 100 | 70 |
15 |
|
| 0 | 0 | 0 | 50 | 30 |
16 |
|
|
| 0 | 10 | 10 | 30 |
17 |
|
|
|
| 0 | 0 | 10 |
18 |
|
|
| 0 | 0 | 0 | 10 |
ASFRs | 0.024 | 0.140 | 0.173 | 0.157 | 0.119 | 0.067 | 0.025 |
The data suggest Total Fertility of about 3.25 children per woman, substantially less than the cohort fertility (5.566) of women aged 45-49. In turn, this suggests either that a dramatic fertility decline is underway in the country, or systematic omission of recent births in the census.
Step 3: Derive proportions at each attained parity and parity progression ratios
Proportions attaining parity i or higher are calculated from the data in Table 1, and are presented in Table 3. Parities 12 and greater are combined.
Table 3 Proportion of women ever-attaining each parity by age group, Cambodia, 1998 Census
| Age group | |||||||||
|---|---|---|---|---|---|---|---|---|---|---|
Parity (i) | 15-19 | 20-24 | 25-29 | 30-34 | 35-39 | 40-44 | 45-49 | 50-54 | 55-59 | 60-64 |
0 | 1 | 1 | 1 | 1 | 1 | 1 | 1 | 1 | 1 | 1 |
1 | 0.0589 | 0.4866 | 0.7700 | 0.8662 | 0.9089 | 0.9227 | 0.9315 | 0.9450 | 0.9481 | 0.9420 |
2 | 0.0140 | 0.2439 | 0.5963 | 0.7724 | 0.8520 | 0.8669 | 0.8754 | 0.8910 | 0.8936 | 0.8791 |
3 | 0.0051 | 0.0838 | 0.3483 | 0.6109 | 0.7624 | 0.7931 | 0.8036 | 0.8188 | 0.8278 | 0.8114 |
4 | 0.0027 | 0.0283 | 0.1545 | 0.4279 | 0.6396 | 0.6997 | 0.7192 | 0.7335 | 0.7518 | 0.7429 |
5 | 0.0009 | 0.0107 | 0.0574 | 0.2528 | 0.4888 | 0.5803 | 0.6169 | 0.6318 | 0.6611 | 0.6572 |
6 | 0.0000 | 0.0054 | 0.0212 | 0.1280 | 0.3354 | 0.4487 | 0.5058 | 0.5213 | 0.5517 | 0.5556 |
7 | 0.0000 | 0.0025 | 0.0090 | 0.0548 | 0.1984 | 0.3168 | 0.3910 | 0.4096 | 0.4418 | 0.4522 |
8 | 0.0000 | 0.0012 | 0.0043 | 0.0224 | 0.1022 | 0.2051 | 0.2833 | 0.3035 | 0.3320 | 0.3367 |
9 | 0.0000 | 0.0000 | 0.0020 | 0.0080 | 0.0469 | 0.1212 | 0.1866 | 0.2082 | 0.2312 | 0.2357 |
10 | 0.0000 | 0.0000 | 0.0010 | 0.0036 | 0.0211 | 0.0678 | 0.1194 | 0.1370 | 0.1540 | 0.1581 |
11 | 0.0000 | 0.0000 | 0.0005 | 0.0015 | 0.0081 | 0.0327 | 0.0661 | 0.0767 | 0.0874 | 0.0927 |
12+ | 0.0000 | 0.0000 | 0.0003 | 0.0007 | 0.0033 | 0.0178 | 0.0383 | 0.0465 | 0.0545 | 0.0592 |
The proportion of women who have had i or more births is shown in Table 3. Thus, while 80.4 per cent of women aged 45-49 have had at least three births, only 71.9 per cent of women have had four or more births. The associated parity progression ratios, , are shown in Table 4.
Table 4 Observed parity progression ratios by mother's age group and parity, Cambodia, 1998 Census
| Age group | |||||||||
|---|---|---|---|---|---|---|---|---|---|---|
Parity (i) | 15-19 | 20-24 | 25-29 | 30-34 | 35-39 | 40-44 | 45-49 | 50-54 | 55-59 | 60-64 |
0 | 0.0589 | 0.4866 | 0.7700 | 0.8662 | 0.9089 | 0.9227 | 0.9315 | 0.9450 | 0.9481 | 0.9420 |
1 | 0.2377 | 0.5013 | 0.7744 | 0.8917 | 0.9374 | 0.9395 | 0.9398 | 0.9429 | 0.9425 | 0.9333 |
2 | 0.3679 | 0.3435 | 0.5840 | 0.7909 | 0.8949 | 0.9149 | 0.9180 | 0.9190 | 0.9263 | 0.9230 |
3 | 0.5259 | 0.3378 | 0.4437 | 0.7004 | 0.8389 | 0.8822 | 0.8950 | 0.8958 | 0.9082 | 0.9156 |
4 | 0.3443 | 0.3770 | 0.3717 | 0.5909 | 0.7642 | 0.8294 | 0.8578 | 0.8613 | 0.8794 | 0.8846 |
5 | 0.0000 | 0.5060 | 0.3698 | 0.5063 | 0.6862 | 0.7732 | 0.8199 | 0.8251 | 0.8345 | 0.8454 |
6 | 0.4692 | 0.4214 | 0.4283 | 0.5915 | 0.7060 | 0.7730 | 0.7858 | 0.8008 | 0.8140 | |
7 | 0.4848 | 0.4854 | 0.4091 | 0.5151 | 0.6473 | 0.7244 | 0.7409 | 0.7513 | 0.7446 | |
8 | 0.0000 | 0.4623 | 0.3560 | 0.4586 | 0.5909 | 0.6589 | 0.6862 | 0.6965 | 0.7001 | |
9 | 0.5217 | 0.4485 | 0.4498 | 0.5593 | 0.6397 | 0.6577 | 0.6662 | 0.6707 | ||
10 | 0.5000 | 0.4054 | 0.3827 | 0.4824 | 0.5534 | 0.5599 | 0.5677 | 0.5864 | ||
11 | 0.5000 | 0.4667 | 0.4133 | 0.5438 | 0.5792 | 0.6063 | 0.6232 | 0.6388 | ||
The ratios suggest that around 93.2 per cent of women aged 45-49 in the 1998 Cambodia Census had had at least one child, while 89.5 per cent of women in this age group who had had three children went on to have a fourth.
Step 4: Derive age-order specific fertility rates
The reported births in the last year (by age and parity) in Table 2 are divided by the total number of women in each age group (the total, by age group, in Table 1). The resulting age-order specific fertility rates are shown in Table 5. Thus, for example, 5AOSFR25(1) = 11,500/458,100 = 0.0251.
Table 5 Age-order specific and total order fertility rates (TOFR), Cambodia, 1998 Census
| Age group | |||||||
|---|---|---|---|---|---|---|---|---|
Parity (i) | 15-19 | 20-24 | 25-29 | 30-34 | 35-39 | 40-44 | 45-49 | TOFR(i) |
0 | ||||||||
1 | 0.0194 | 0.0601 | 0.0251 | 0.0077 | 0.0028 | 0.0011 | 0.0008 | 0.5847 |
2 | 0.0035 | 0.0491 | 0.0465 | 0.0189 | 0.0054 | 0.0025 | 0.0006 | 0.6326 |
3 | 0.0006 | 0.0214 | 0.0494 | 0.0277 | 0.0102 | 0.0029 | 0.0010 | 0.5660 |
4 | 0.0003 | 0.0062 | 0.0313 | 0.0341 | 0.0140 | 0.0049 | 0.0013 | 0.4603 |
5 | 0.0001 | 0.0015 | 0.0136 | 0.0301 | 0.0181 | 0.0062 | 0.0020 | 0.3582 |
6 | 0.0000 | 0.0007 | 0.0044 | 0.0202 | 0.0218 | 0.0097 | 0.0023 | 0.2959 |
7 | 0.0000 | 0.0002 | 0.0016 | 0.0107 | 0.0194 | 0.0109 | 0.0035 | 0.2320 |
8 | 0.0000 | 0.0002 | 0.0008 | 0.0051 | 0.0133 | 0.0102 | 0.0031 | 0.1632 |
9 | 0.0000 | 0.0000 | 0.0002 | 0.0015 | 0.0075 | 0.0078 | 0.0029 | 0.0996 |
10 | 0.0000 | 0.0000 | 0.0001 | 0.0007 | 0.0037 | 0.0053 | 0.0027 | 0.0625 |
11 | 0.0000 | 0.0000 | 0.0001 | 0.0004 | 0.0017 | 0.0027 | 0.0020 | 0.0346 |
12+ | 0.0000 | 0.0000 | 0.0000 | 0.0002 | 0.0009 | 0.0030 | 0.0025 | 0.0335 |
ASFR | 0.0239 | 0.1396 | 0.1731 | 0.1574 | 0.1189 | 0.0670 | 0.0247 | 3.5231 |
Step 5: Derive cumulated order-specific fertility rates
From the data presented in Table 5, cumulated age-order specific fertility rates can be derived by summing along each row to the desired age group. Thus, for example, the cumulated age-order specific rate up to the end of the 25-29 age group for parity 3 would be 5 x (0.0006 + 0.0214 + 0.0494)=0.3572.
Step 6: Calculate the age distribution of order-specific fertility rates, and interpolate to conventional ages
Using the results from Step 5, the proportion of order-specific fertility achieved by the end of each age group is derived by dividing the cumulated order-specific fertility rates by the total order specific fertility rate shown in the last column of Table 5. The results are shown in Table 6.
Table 6 Proportion of order-specific fertility achieved by the end of each group, Cambodia, 1998 Census
| Age group | ||||||
|---|---|---|---|---|---|---|---|
Parity (i) | 19.5 | 24.5 | 29.5 | 34.5 | 39.5 | 44.5 | 49.5 |
0 |
| ||||||
1 | 0.1658 | 0.6799 | 0.8945 | 0.9601 | 0.9840 | 0.9932 | 1.0000 |
2 | 0.0274 | 0.4153 | 0.7832 | 0.9329 | 0.9756 | 0.9951 | 1.0000 |
3 | 0.0054 | 0.1946 | 0.6311 | 0.8762 | 0.9663 | 0.9915 | 1.0000 |
4 | 0.0034 | 0.0709 | 0.4107 | 0.7815 | 0.9334 | 0.9864 | 1.0000 |
5 | 0.0021 | 0.0235 | 0.2130 | 0.6331 | 0.8861 | 0.9721 | 1.0000 |
6 | 0.0000 | 0.0121 | 0.0866 | 0.4284 | 0.7973 | 0.9606 | 1.0000 |
7 | 0.0000 | 0.0050 | 0.0402 | 0.2712 | 0.6895 | 0.9245 | 1.0000 |
8 | 0.0000 | 0.0071 | 0.0311 | 0.1868 | 0.5928 | 0.9042 | 1.0000 |
9 | 0.0000 | 0.0000 | 0.0099 | 0.0876 | 0.4654 | 0.8556 | 1.0000 |
10 | 0.0000 | 0.0000 | 0.0070 | 0.0650 | 0.3639 | 0.7866 | 1.0000 |
11 | 0.0000 | 0.0000 | 0.0095 | 0.0654 | 0.3103 | 0.7046 | 1.0000 |
12+ | 0.0000 | 0.0000 | 0.0065 | 0.0318 | 0.1724 | 0.6201 | 1.0000 |
The proportion of fertility achieved by age 49.5 is assumed to be one. Using the same example as in the previous step, the proportion of third order-specific fertility achieved by age 29.5 is 0.3572/0.5660=0.6311.
Because mothers’ ages are classified by their age at the census and the average parities derived in Step 1 apply to ages 17½, 22½ etc., to render the two sets of data comparable, we interpolate between pairs of values to get the estimated proportions at ages 22½, 27½ etc. The formula for doing this is given in Equation 1, and the results are shown in Table 7.
Due to the inherent uncertainty surrounding the projection of future parity progression, cells in Table 7 with a value of less than 0.3 (i.e., less than 30 per cent of order fertility has been achieved by the age indicated) are marked in red, and will be excluded from further calculations. Values greater than 0.3 but less than 0.5 are marked in blue, and should be treated with circumspection in further calculations. Calculations depending on these values will be presented in brackets in subsequent tabulations.
Table 7 Proportion of order fertility achieved by the mid-point of each age interval, Cambodia, 1998 Census
| Age group | |||||
|---|---|---|---|---|---|---|
Parity (i) | 22.5 | 27.5 | 32.5 | 37.5 | 42.5 | 47.5 |
1 | 0.4897 | 0.8326 | 0.9409 | 0.9769 | 0.9904 | 0.9999 |
2 | 0.2135 | 0.6652 | 0.8915 | 0.9634 | 0.9906 | 0.9999 |
3 | 0.0739 | 0.4655 | 0.8044 | 0.9428 | 0.9852 | 0.9999 |
4 | 0.0275 | 0.2526 | 0.6624 | 0.8916 | 0.9742 | 0.9998 |
5 | 0.0102 | 0.1104 | 0.4751 | 0.8139 | 0.9506 | 0.9998 |
6 |
| 0.0452 | 0.2738 | 0.6811 | 0.9228 | 0.9997 |
7 |
| 0.0197 | 0.1539 | 0.5410 | 0.8640 | 0.9996 |
8 |
| 0.0183 | 0.1061 | 0.4345 | 0.8232 | 0.9996 |
9 |
| 0.0430 | 0.2965 | 0.7449 | 0.9995 | |
10 |
| 0.0311 | 0.2221 | 0.6527 | 0.9994 | |
11 |
| 0.0341 | 0.1937 | 0.5671 | 0.9993 | |
12+ |
| 0.0181 | 0.1001 | 0.4473 | 0.9993 | |
Step 7: Calculate the expected future order increment
The additional proportion of women reaching each parity in the interval from the mid-point of the age group to the end of childbearing is given by
as shown in Table 8.
Table 8 Additional proportion attaining parity (i) by the end of childbearing by age group of mother, Cambodia, 1998 Census
Parity (i) | 22.5 | 27.5 | 32.5 | 37.5 | 42.5 |
|---|---|---|---|---|---|
0 | |||||
1 | (0.2984) | 0.0979 | 0.0346 | 0.0135 | 0.0056 |
2 | 0.2118 | 0.0686 | 0.0232 | 0.0059 | |
3 | (0.3025) | 0.1107 | 0.0324 | 0.0084 | |
4 | 0.1554 | 0.0499 | 0.0119 | ||
5 | (0.1880) | 0.0666 | 0.0177 | ||
6 | 0.0944 | 0.0228 | |||
7 | 0.1065 | 0.0316 | |||
8 | (0.0923) | 0.0289 | |||
9 | 0.0254 | ||||
10 | 0.0217 | ||||
11 | 0.0150 | ||||
12+ | (0.0185) |
Thus, the anticipated future order increment after age 30 at parity 3 is given by 0.5660 x (1 - 0.4655) = 0.3025. Values shown in brackets are less reliable as they are based on proportions of age-order specific fertility attained by the mid-point of that age group of less than half.
Step 8: Derive expected projected proportions attaining each parity order and projected parity progression ratios
The projected cumulated parity progression ratios are calculated by adding the future order increments presented in Table 8 to the proportion of women who have ever attained each parity calculated in Step 3 and presented in Table 3.
The projected PPRs for cohorts who are still bearing children can now be compared directly with the completed PPRs of women aged 50 or more. The results are shown in Table 10.
Table 9 Projected proportions expected to attain each parity, Cambodia, 1998 Census
| Age group | ||||||||
|---|---|---|---|---|---|---|---|---|---|
Parity (i) | 20-24 | 25-29 | 30-34 | 35-39 | 40-44 | 45-49 | 50-54 | 55-59 | 60-64 |
0 | 1.0000 | 1.0000 | 1.0000 | 1.0000 | 1.0000 | 1.0000 | 1.0000 | 1.0000 | 1.0000 |
1 | (0.7850) | 0.8679 | 0.9008 | 0.9224 | 0.9283 | 0.9315 | 0.9450 | 0.9481 | 0.9420 |
2 | 0.8081 | 0.8410 | 0.8752 | 0.8728 | 0.8754 | 0.8910 | 0.8936 | 0.8791 | |
3 | (0.6508) | 0.7216 | 0.7948 | 0.8014 | 0.8036 | 0.8188 | 0.8278 | 0.8114 | |
4 | 0.5833 | 0.6895 | 0.7115 | 0.7192 | 0.7335 | 0.7518 | 0.7429 | ||
5 | (0.4408) | 0.5554 | 0.5980 | 0.6169 | 0.6318 | 0.6611 | 0.6572 | ||
6 | 0.4298 | 0.4715 | 0.5058 | 0.5213 | 0.5517 | 0.5556 | |||
7 | 0.3049 | 0.3483 | 0.3910 | 0.4096 | 0.4418 | 0.4522 | |||
8 | (0.1945) | 0.2339 | 0.2833 | 0.3035 | 0.3320 | 0.3367 | |||
9 | 0.1466 | 0.1866 | 0.2082 | 0.2312 | 0.2357 | ||||
10 | 0.0895 | 0.1194 | 0.1370 | 0.1540 | 0.1581 | ||||
11 | 0.0477 | 0.0661 | 0.0767 | 0.0874 | 0.0927 | ||||
12+ | (0.0363) | 0.0383 | 0.0465 | 0.0545 | 0.0592 | ||||
In the 25-29 age group, the projected proportion with parity 3 and over is 0.3483 (from Table 3) + 0.3025 (from Table 8) = 0.6508. Values shown in brackets are less reliable as they are based on proportions of age-order specific fertility attained by the mid-point of that age group of less than half.
Projected parity progression ratios are derived by division of the proportions expected to attain each successive parity in any given age cohort (Table 10).
Table 10 Projected parity progression rations, Cambodia, 1998 Census
| Age group | ||||||||
|---|---|---|---|---|---|---|---|---|---|
Parity (i) | 20-24 | 25-29 | 30-34 | 35-39 | 40-44 | 45-49 | 50-54 | 55-59 | 60-64 |
0 | (0.7850) | 0.8679 | 0.9008 | 0.9224 | 0.9283 | 0.9315 | 0.9450 | 0.9481 | 0.9420 |
1 | 0.9312 | 0.9337 | 0.9488 | 0.9403 | 0.9398 | 0.9429 | 0.9425 | 0.9333 | |
2 | (0.8053) | 0.8580 | 0.9081 | 0.9182 | 0.9180 | 0.9190 | 0.9263 | 0.9230 | |
3 | 0.8083 | 0.8676 | 0.8878 | 0.8950 | 0.8958 | 0.9082 | 0.9156 | ||
4 | (0.7558) | 0.8055 | 0.8404 | 0.8578 | 0.8613 | 0.8794 | 0.8846 | ||
5 | 0.7738 | 0.7885 | 0.8199 | 0.8251 | 0.8345 | 0.8454 | |||
6 | 0.7094 | 0.7388 | 0.7730 | 0.7858 | 0.8008 | 0.8140 | |||
7 | (0.6379) | 0.6715 | 0.7244 | 0.7409 | 0.7513 | 0.7446 | |||
8 | 0.6266 | 0.6589 | 0.6862 | 0.6965 | 0.7001 | ||||
9 | 0.6104 | 0.6397 | 0.6577 | 0.6662 | 0.6707 | ||||
10 | 0.5326 | 0.5534 | 0.5599 | 0.5677 | 0.5864 | ||||
11 | (0.7611) | 0.5792 | 0.6063 | 0.6232 | 0.6388 | ||||
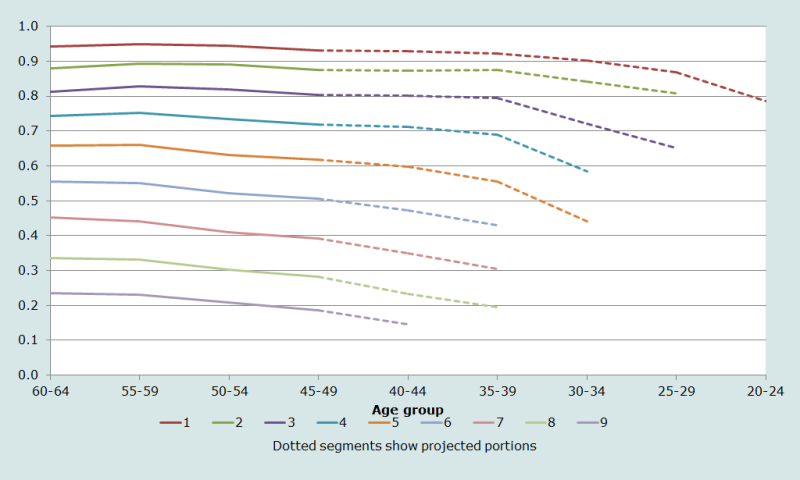
Projected parity progression ratios
The parity progression ratio from 0 to 1 shows the proportion of women who have ever had a child. Note how the projected parity progression ratio at this parity suffers from extensive bias, as discussed in detail below. The proportion of childless women has remained roughly constant by cohort. However, as can be seen from Figure 1, at parities 2 and greater there is a clear trend for slightly lower parity progression in each successively younger cohort.

The projected proportions expected to attain each parity from the 1998 Cambodia Census are shown in Figure 2.
The effects of the lower parity progression ratios for younger cohorts is evident in the proportions expected to attain each parity. Thus while 55 per cent of women aged 60-64 had had 6 or more children, in the cohort now completing its childbearing (that aged 45-49), the proportion had declined to just over half (50.6 per cent).
The data indicate the makings of an incipient decline in fertility that began roughly – when the cohort currently aged 50-54 was having their children, approximately 25-30 years before the census.
Entry into motherhood
In the case of the Cambodian data, the actual proportion of women 45-49 who had ever had a child was 0.9315. The projected proportions, by current age of mother, are shown in the first row of Table 10.
It would certainly appear that there have been some significant changes in the timing of entry into motherhood among younger cohorts, although the results for women in their twenties, and quite probably those aged 30-34 too, are implausible for reasons discussed in relation to the derivation of the results earlier. The projected parity progression ratios for women in their twenties are strongly affected both by changes in the timing of childbearing, as well as being strongly affected by the projected components. These results should be ignored, or alternatively a life-table approach to estimating entry into motherhood should be applied. Such methods and their calculation are outside the scope of this manual.
With the exception of this metric, however, the calculation of projected PPRs should eliminate the effect of reference period errors in the resulting PPRs in so far as they are independent of parity. This can be seen in the estimates of the projected parity progression ratios for other parities.
The data for the 20-24 to 40-44 cohorts contain a projected component which is more significant the younger the cohort. Data for older cohorts are based on completed fertility. The projected parity progression ratios for women aged 30-44 indicate a systematic decline in the proportion of women in each successively younger cohort expected to progress to the next parity by the end of their childbearing years. This is indicative of fertility decline underway.
Further reading and references
A similar approach to that presented above, but which makes use of the detailed data collected in birth histories and also takes more careful account of the censoring and selection effects is described in Brass and Juárez (1983).
There is a sizable literature on the use and problems associated with period (as opposed to cohort) parity progression ratios. These fall outside of the scope of this manual. The interested reader is referred to Whelpton (1946), Feeney and Yu (1987), Ní Bhrolcháin (1987), Hinde (1998), and Bongaarts and Feeney (1998).
Bongaarts J and G Feeney. 1998. "On the quantum and tempo of fertility", Population and Development Review 24(2):271-291. doi: https://dx.doi.org/10.2307/2807974
Brass W. 1985. Advances in Methods for Estimating Fertility and Mortality from Limited and Defective Data. London: Centre for Population Studies, London School of Hygiene and Tropical Medicine.
Brass W and F Juárez. 1983. "Censored cohort parity progression ratios from birth histories", Asian and Pacific Census Forum 10(1):5-12. https://hdl.handle.net/10125/3583
Feeney G and J Yu. 1987. "Period parity progression measures of fertility in China", Population Studies 41(1):77-102. doi: https://dx.doi.org/10.1080/0032472031000142546
Hinde A. 1998. Demographic Methods. London: Arnold
Ní Bhrolcháin M. 1987. "Period parity progression ratios and birth intervals in England and Wales, 1941-1971: A synthetic life table analysis", Population Studies 41(1):103-125. doi: https://dx.doi.org/10.1080/0032472031000142556
Preston SH, P Heuveline and M Guillot. 2001. Demography: Measuring and Modelling Population Processes. Oxford: Blackwell.
Whelpton PK. 1946. "Reproduction rates adjusted for age, parity, fecundity, and marriage", Journal of the American Statistical Association 41(236):501-516. doi: https://dx.doi.org/10.1080/01621459.1946.10501893
- Printer-friendly version
- Log in to post comments