Evaluation of data on recent fertility from censuses
Introduction
Before evaluating the data on recent fertility collected in a census, it is important to examine the precise wording of the questions used to capture information on recent births by consulting the questionnaire. Over successive waves of censuses, and in different countries, widely different questions have been used. The wording can influence the validity of the estimates and the direction and magnitude of biases or errors in the data.
The generic forms of the census questions on recent fertility fall into three broad categories:
- Did you give birth in the last year (or other reference period)?
This question produces a simple binary answer. Multiple births in the same reference period are not captured. These could arise from the birth of twins or triplets from a single pregnancy, or from a very short birth interval separating two different pregnancies. Neither of these outcomes is likely to influence the overall fertility rate to a large extent in that birth intervals shorter than a year are rare, and the probability that a pregnancy will result in multiple births is less than 2 per cent in most settings (sub-Saharan Africa being a possible exception). When faced with data collected in this form, it is recommended that the simplifying assumption be made that all births occurred halfway through the reference period, and that only one live birth resulted from each pregnancy.
- How many children have you given birth to in the last year (or other reference period)?
This question is more refined than the first form given above. It does not yield information on the timing of birth within the reference period, but it does capture information on multiple births to the same woman, without distinguishing between twins and short birth intervals. Again, it is reasonable for the purposes of calculation to assume that the births occurred halfway through the reference period.
- What was the date of your last live birth?
This question seeks to identify the timing of the last delivery with a greater degree of accuracy, although typically only the month and year of the last birth are recorded. If there are follow-up questions on the number of births that occurred at that time these give more accurate information on the number of recent births.
Additional questions (for example, on the survival of the last born child; the sex of last born child; or the date of the last-but-one birth) are occasionally encountered. Answers to such questions can be used, for example, to estimate, directly from the data, child mortality rates by sex or a sex ratio at birth.
In evaluating the quality of data on recent fertility, the following checks might be conducted:
- Comparison of the total number of births with that expected (for example, against numbers from a vital registration system, or from application of an accurate series of age-specific fertility rates to the enumerated population of women – although in the latter case, systematic under-enumeration of the women might also cause the rates to be underestimated).
- Assessment of the plausibility of the distribution of age-specific fertility rates calculated directly from the data. Plausible fertility distributions are almost invariably unimodal, concave, slightly right-skewed, and close to zero at the extremes of the childbearing age range. The distribution should also exhibit a reasonably smooth progression of fertility rates from one age to the next;
- Plausibility checks on the reported numbers of births in the reference period. In some censuses (e.g. South Africa 1996), a significant proportion of respondents confused the questions on lifetime and recent fertility, and gave the same answers to both questions. This error manifests itself in a strong diagonal in tabulations of children ever born by children born in the last year by age of mother (Moultrie and Timæus 2002);
- If data on the sex of the last born child have been collected, the reported sex ratio at birth should be checked. The sex ratio at birth is usually about 1.05, but could be as low as 0.95 in African populations and up to 1.1 in some Asian populations. Values outside the range of 0.99 to 1.06 should be subjected to careful scrutiny.
In all cases, care must be taken to identify correctly the universe of women required to answer the questions (in particular the ages and marital status of eligible respondents), as well as the rules governing recording and coding of non-response and incorrect data.
Assessment of current fertility data
Before proceeding with an analysis of age-specific fertility rates, it is advisable to investigate the extent to which the data on recent births are missing or implausible. The absence of any missing data almost certainly indicates that the data have been edited. If this is suspected, further investigations into the extent of editing and/or imputation of the data are recommended to the extent that this is possible, for example through examination of the distribution of imputed values where imputation flag variables are included in the data.
The proportion of the data that is missing should also be checked. If this exceeds five per cent of the total number of records relevant for current fertility data, further investigations should be done. In particular, one should examine the age distribution of missing cases. If these are concentrated among young women or women in their forties this would suggest that the missing cases are missing because these mothers did not have a birth in the reference period, and no answer was recorded by the enumerator rather than an entry of zero being made. This is an error very similar to that giving rise to the el-Badry correction.
When the data are tabulated by the number of births in the reference period (as opposed to simply whether or not a birth occurred in the reference period), the distribution of single versus multiple births should be investigated. Generally, less than 2 per cent of pregnancies result in multiple births. Triplets and higher order multiple births are exceedingly rare (less than 0.5 per cent of deliveries). If the proportion of multiple births in the reference period seems too high, it is recommended that tabulations of children ever born and births in the last year are produced for each age group of women. If children ever born and births in the last year are equal in a large proportion of cases, even for parities two and over, this may suggest that respondents or enumerators did not understand the distinction between the questions on lifetime and recent fertility. However, it is possible that a large proportion of younger women with only one child ever born gave birth to that child in the reference period and a close match between lifetime reports of just one birth and recent reports of one birth in young women may not indicate reporting errors.
Direct measurement of fertility from census data
When the data are of sufficient quality, it is possible to estimate age-specific fertility rates directly. When the data are of inferior quality, age-specific fertility rates from the direct calculation are used as inputs into various methods that aim to produce more reliable estimates of the level of fertility using indirect techniques.
The exact form of the age-specific fertility rates that can be derived hinges on the nature of the data collected. An age-specific fertility rate at any given age (or in any age group) is the ratio of the number of births to women of that age (in that age group) in a defined period to the number of person-years lived by women of the same age (in the same age group) in that time period. To calculate age-specific fertility rates exactly, one would need to know reliably the exact dates of birth of mothers (to establish the mother’s age) and their children. One can then calculate precisely the age of the mother at the birth of her child, as well as allocate her exposure to risk to the relevant ages or age groups over the period of investigation.
The data required for such precise calculations are not usually available in census microdata records, either because exact dates were not collected in the first place, or because of the potential for breaching confidentiality if full dates of birth are provided to end-users of the data. In addition, census data are often of insufficient quality to warrant the additional precision. Heaping of months of birth (e.g. on January) as well as years of birth (e.g. those ending in 0 or 5) are commonly encountered problems. Extended census enumeration periods can introduce problems with translating a reference period (e.g. within the last year from the interview date) to a calendar time period (e.g. 2008). Furthermore, retrospective questions about recent births asked in a census fail to capture information about births to mothers who have since died or left the country.
Four possible combinations of reporting of mother’s vital information, and recent births, are typically encountered (Table 1).
Table 1 Taxonomy of data on mother and children for estimating recent fertility
|
|
|
Mothers’ vital information |
|
|
|
|
Age in completed years at census |
Date of birth |
|
Reporting of children born in the preceding period(*) |
Number of children born |
(1) |
(2) |
|
Date of birth of last born child |
(3) |
(4) |
|
(*)Typically the preceding period is 12 months, but analysts should be alert to non-standard reference periods, for example based on time elapsed since an important national event or holiday
Even in the fourth case identified in Table 1, which contains the most detailed information, expending effort to calculate accurately the exposure to risk for the purposes of estimating fertility is not generally warranted, as heaping of dates on particular months and other data quality problems could severely distort the resulting estimates. Thus, use of simple approximations for the calculation of fertility rates from census data is usually appropriate. The section on the direct measurement of fertility from survey data describes the more precise calculation of the exposure to risk and estimation of fertility rates from data of good quality.
Cases 1 and 2: Estimation of age-specific fertility rates directly from the data when no information is available on the timing of the child’s birth
In the first two cases identified in Table 1, all that might be known about the mother’s recent fertility is whether or not she gave birth to at least one child in the period before the census. In more informative variants of the recent fertility question, the mother may be asked about the number of live births in the period preceding the census. Such a question allows the identification both of multiple births from the same pregnancy (twins, triplets etc.), as well as instances of more than one pregnancy ending in the defined period.
Since the mother’s age at birth is not known, the approximation usually used is to tabulate the fertility rates by the reported age of the mother at the census date. The additional assumption is then made that all births occurred half-way through the interval in question. This means that mothers are, on average, older by half the interval length at the time of the census, with the implication that the ages to which the fertility rates actually refer are younger than the reported ages at census. Most standard methods of estimating fertility indirectly compensate for the displacement of ages arising from this mismatch.
The additional information (on mother’s month and year of birth) available in the second case is not particularly helpful in refining the estimates of fertility since additional assumptions of uniformity of the distribution of children’s birthdays are still required. Thus, where the data that were collected fall into either the first or the second case identified in Table 1, fertility rates are estimated by dividing the count of children reported born in the reference period (by age of mother at the census date) by the number of women of that age. The total number of births in the reference period reported by women aged x at the census date, Bx, is given by
where k is the reported number of births in the reference period, ω is the maximum value of k in the data and Nx,k is the number of women aged x at the census reporting k births in the last year. If ω is classified as an open interval, e.g. 3+ births in the reference period, women in that category are all assumed to have had the number of births that opens that interval. Again, the error thus introduced is small.
The number of women aged x is given by
Women whose recent births are unknown or unrecorded must be excluded from both the numerator and denominator, with the implicit assumption that their fertility is no different from that of women whose recent fertility is known. Age-specific fertility rates (ASFRs) at age x are given by
Using the conventional age range (from 15 to 49, inclusive) as the limits for the summation, the implied Total Fertility (TF) from the single-age data is
Total fertility is a synthetic cohort measure – indicating the number of children a woman would have if she survives to age 50 (deemed to be the end of childbearing) and experiences the age-specific fertility rates currently observed immediately before the census throughout her reproductive life.
Fertility rates by single years of age should be calculated and plotted to check the internal coherence of the data. The ASFRs will tend to be less erratic than either the numerators or the denominators on their own, and may indicate plausible levels and distributions of fertility. A highly erratic series of age-specific fertility rates by age, departing markedly from the anticipated n-shape, offers a strong indication that the recent fertility data are problematic, and suggests that further investigations are required.
Finally, age-specific fertility rates in conventional five-year bands, 5fx, where x = 15, 20,…,45, can be derived:
where the index, i, is determined by the relation i=(x/5) - 2. The measure of total fertility is thus
While the TF is an age-standardized measure of fertility (implicitly assuming a uniform distribution of the population of child-bearing population of women by age in each age group), the fertility rate in any age group is not standardized within the group. As a result, the TF derived from calculations using age-groups and single years of age will differ to a small degree, typically in the second or third decimal place.
Total fertility should be compared with estimates from other data sources from the same country (e.g. DHS). It is worth remembering, however, that the ASFRs and TF produced using this method do not take into account the true exposure-to risk in the derivation of the denominator. In addition, the numerator includes events that took place during the reference period categorized by the age of the mother at the end of the reference period, not by her age at the time the event took place. Most methods of indirect fertility estimation adjust the derived fertility rates to account for this age shift. For purposes of basic comparison (that is, assessing the shape and level of the fertility distributions), the differences in classification by age are not of major importance. However, the F-only variant of the relational Gompertz model provides a method of unshifting fertility rates while smoothing them, should this be desired.
Example: Direct calculation of fertility
In the 2008 Cambodian Census, women were asked about the number of children they gave birth to in the previous year. Mother’s age was classified by age at the census date. The data are shown in Table 2.
Table 2 Recent fertility by age of mother at the census date, Cambodia, 2008 Census
|
|
Births in the last year |
|
|
|
|||||
|
Age |
0 |
1 |
2 |
3 |
4 |
Missing |
Births |
Women |
ASFR |
|
15 |
160,980 |
120 |
0 |
0 |
0 |
80 |
120 |
161,180 |
0.0007 |
|
16 |
152,710 |
500 |
0 |
0 |
0 |
50 |
500 |
153,260 |
0.0033 |
|
17 |
144,970 |
1,250 |
10 |
10 |
0 |
20 |
1,300 |
146,260 |
0.0089 |
|
18 |
182,500 |
3,540 |
20 |
0 |
0 |
40 |
3,580 |
186,100 |
0.0192 |
|
19 |
127,840 |
5,640 |
10 |
0 |
0 |
30 |
5,660 |
133,520 |
0.0424 |
|
20 |
147,990 |
8,840 |
80 |
0 |
0 |
90 |
9,000 |
157,000 |
0.0574 |
|
21 |
123,960 |
9,500 |
30 |
0 |
0 |
70 |
9,560 |
133,560 |
0.0716 |
|
22 |
126,030 |
11,600 |
80 |
0 |
0 |
30 |
11,760 |
137,740 |
0.0854 |
|
23 |
123,750 |
11,830 |
70 |
10 |
0 |
110 |
12,000 |
135,770 |
0.0885 |
|
24 |
121,820 |
11,010 |
150 |
10 |
20 |
80 |
11,420 |
133,090 |
0.0859 |
|
25 |
137,460 |
12,420 |
100 |
0 |
0 |
60 |
12,620 |
150,040 |
0.0841 |
|
26 |
115,370 |
11,320 |
110 |
0 |
0 |
80 |
11,540 |
126,880 |
0.0910 |
|
27 |
117,840 |
11,580 |
190 |
0 |
0 |
40 |
11,960 |
129,650 |
0.0923 |
|
28 |
118,270 |
10,690 |
110 |
0 |
10 |
30 |
10,950 |
129,110 |
0.0848 |
|
29 |
82,990 |
7,600 |
120 |
0 |
0 |
40 |
7,840 |
90,750 |
0.0864 |
|
30 |
77,690 |
5,950 |
40 |
10 |
0 |
30 |
6,060 |
83,720 |
0.0724 |
|
31 |
58,800 |
4,820 |
50 |
20 |
0 |
30 |
4,980 |
63,720 |
0.0782 |
|
32 |
67,110 |
4,480 |
150 |
20 |
0 |
110 |
4,840 |
71,870 |
0.0674 |
|
33 |
67,080 |
4,240 |
40 |
0 |
0 |
50 |
4,320 |
71,410 |
0.0605 |
|
34 |
67,010 |
3,800 |
30 |
10 |
10 |
70 |
3,930 |
70,930 |
0.0555 |
|
35 |
90,720 |
4,570 |
60 |
20 |
0 |
30 |
4,750 |
95,400 |
0.0498 |
|
36 |
77,950 |
3,800 |
10 |
10 |
0 |
30 |
3,850 |
81,800 |
0.0471 |
|
37 |
81,320 |
4,070 |
50 |
10 |
10 |
10 |
4,240 |
85,470 |
0.0496 |
|
38 |
92,290 |
3,780 |
30 |
20 |
30 |
30 |
4,020 |
96,180 |
0.0418 |
|
39 |
74,030 |
2,920 |
50 |
0 |
0 |
30 |
3,020 |
77,030 |
0.0392 |
|
40 |
88,940 |
2,720 |
70 |
10 |
10 |
50 |
2,930 |
91,800 |
0.0319 |
|
41 |
71,250 |
2,140 |
0 |
0 |
0 |
20 |
2,140 |
73,410 |
0.0292 |
|
42 |
81,560 |
2,010 |
30 |
0 |
0 |
60 |
2,070 |
83,660 |
0.0248 |
|
43 |
72,930 |
1,270 |
10 |
0 |
0 |
30 |
1,290 |
74,240 |
0.0174 |
|
44 |
69,660 |
930 |
10 |
0 |
0 |
50 |
950 |
70,650 |
0.0135 |
|
45 |
84,290 |
760 |
30 |
10 |
10 |
30 |
890 |
85,130 |
0.0105 |
|
46 |
67,330 |
510 |
0 |
50 |
30 |
40 |
780 |
67,960 |
0.0115 |
|
47 |
66,220 |
270 |
10 |
0 |
10 |
0 |
330 |
66,510 |
0.0050 |
|
48 |
74,790 |
310 |
10 |
10 |
0 |
30 |
360 |
75,150 |
0.0048 |
|
49 |
57,600 |
120 |
0 |
20 |
10 |
20 |
220 |
57,770 |
0.0038 |
|
TOTAL |
3,473,050 |
170,910 |
1,760 |
250 |
150 |
1,600 |
175,780 |
3,647,720 |
1.6157 |
The “missing” column shows that only 1,600 women, out of nearly 3.65 million aged between 15 and 49, did not have their recent fertility recorded. This represents 0.04 per cent of all women, and will have no material impact on the estimated fertility of women in Cambodia. A further check on the age distribution of these cases shows no clear age pattern of omission. The number of births is given by the weighted sum of women reporting 1, 2, 3 and 4 deliveries, in the last row. This calculation shows that 173,070 women (170,910 + 1,760 + 250 + 150) gave birth to a total of 175,780 births (1x170,910 + 2×1,760 + 3×250 + 4×150) during the year preceding the census. Of these women, 98.8 per cent (170,910 / 173,070) experienced a single birth. 1.0 per cent had twins, and 0.2 per cent triplets or higher-order multiple births. The possibility of quintuplets (or five births in two deliveries over the period) is remote and need not be considered. Had the census not counted the multiple births separately, the crude birth rate would have been under-estimated by a factor of 173,070/175,780 = 0.984. This represents an under-estimate of just 1.6 per cent.
Using the data above, the series of single-age ASFRs is derived by dividing the total number of births to women of each age by the number of women reporting their current fertility, that is, excluding those women who did not report how many births they had in the last year. The rates are shown in Figure 1. Even though the number of women enumerated at each age is erratic, the ASFRs by single years of age are relatively smooth, with a clearly defined fertility pattern and a typical peak in the mid-twenties.
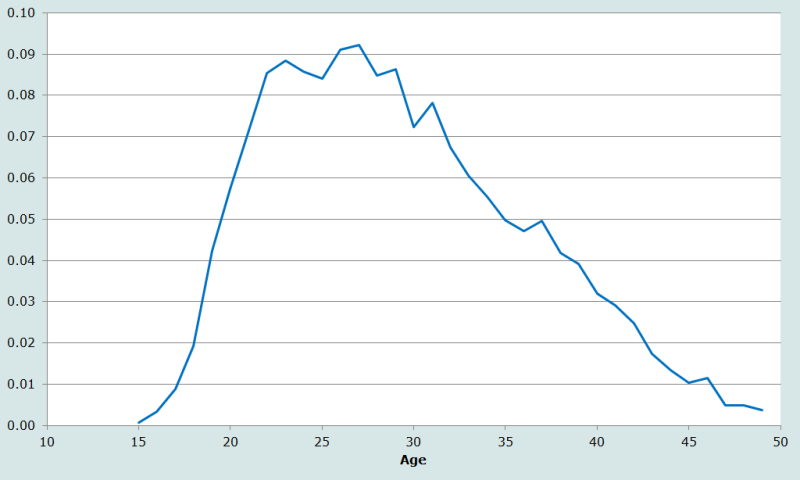
According to these data, total fertility is 1.61 children per woman. Summing births and women in five-year age groups produces the same answer (Table 3), although, as suggested above, the measures do differ in the third decimal place.
Table 3 Age-specific fertility rates in five-year age groups, Cambodia, 2008 Census and 2005 and 2010 Demographic Health Surveys
|
Age group |
Women |
Missing |
Births |
ASFR |
|
DHS2005 |
DHS2010 |
|
15-19 |
780,320 |
220 |
11,160 |
0.014 |
|
0.047 |
0.046 |
|
20-24 |
697,160 |
380 |
53,740 |
0.077 |
|
0.175 |
0.173 |
|
25-29 |
626,430 |
250 |
54,910 |
0.088 |
|
0.180 |
0.167 |
|
30-34 |
361,650 |
290 |
24,130 |
0.067 |
|
0.142 |
0.121 |
|
35-39 |
435,880 |
130 |
19,880 |
0.046 |
|
0.091 |
0.071 |
|
40-44 |
393,760 |
210 |
9,380 |
0.024 |
|
0.041 |
0.028 |
|
45-49 |
352,520 |
120 |
2,580 |
0.007 |
|
0.005 |
0.004 |
|
TF |
|
|
1.61 |
|
3.41 |
3.05 |
|
|
Source: Census estimates, own calculations; DHS StatCompiler (www.statcompiler.com) |
|||||||
Even in the absence of external checks, the results from the 2008 Census data suggest implausibly low levels of fertility in Cambodia. The data are also inconsistent with the average parities calculated in the section on assessment of parity data. This suggests that the data on recent fertility collected in this census are seriously deficient. This is confirmed by external checks, in the form of estimates of fertility from two DHSs conducted before and after the census. The data in the last two columns of Table 3 show that the estimate of total fertility in the 2010 DHS (based on births in the three years before the survey) was 3.1 children per woman. The estimate of total fertility from the 2005 DHS was 3.4 children per woman. It appears that only about half the births that occurred in the year before the census were reported to census enumerators.
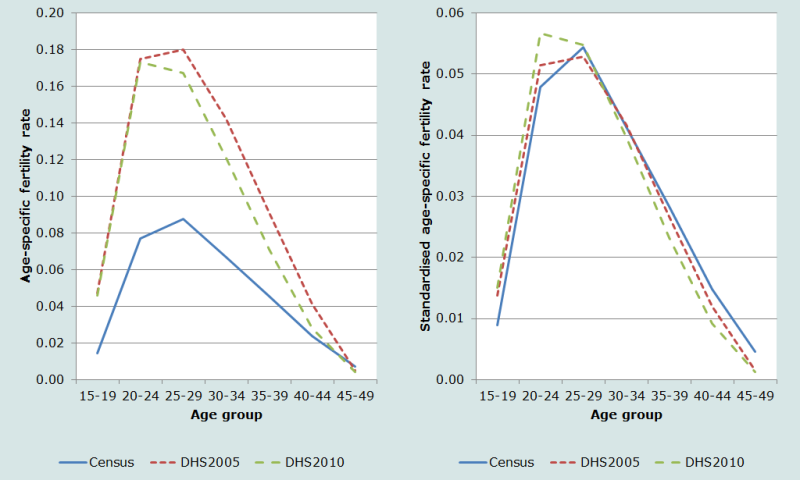
The left-hand panel of Figure 2 shows the age-specific fertility rates calculated from the 2008 Census and the two DHSs. Clearly the fertility rates implied by the census are out of line relative to the DHSs. The latter in turn, show a rather strange pattern of fertility change over the five years, driven by almost constant reductions in fertility between ages 25 and 44. The right-hand panel of Figure 2 shows the same rates, but this time standardized to a TF of one child per woman. Despite substantial differences in the implied level of fertility, the shape of the three fertility distributions are similar, with the only real difference between them being in the 20-24 age group. It is unlikely, therefore, that there were significant differentials in the quality of the reporting of recent fertility in the 2008 Cambodia Census according to the age of women.
This result suggests that, even though the level of fertility implied by the 2008 Census data is seriously flawed, the shape of the fertility distribution is reasonably accurate. This is a prerequisite for applying many of the indirect methods of fertility estimation.
Cases 3 and 4: Estimation of age-specific fertility rates when information is available on the timing of the child’s birth
If the births are classified by women’s date of last birth, a suitable period for the fertility investigation needs to be chosen. In general, it is advisable not to use a period much longer than a year as longer periods of investigation increase the probability that women might have had more than one pregnancy in that period. This results in births earlier in time being omitted (the requirement being to report on the date of birth of the last child, not all children in the period), meaning that estimates of fertility will systematically exclude births in the more distant past. In addition, if fertility has been changing rapidly, extending the period of investigation over more than a year means that the resulting estimates represent some kind of average of fertility over the period. If the census was conducted fairly early or late in the year, however, there is potentially some advantage to basing the rates on births since the beginning of the previous or current year respectively as this does not require women to remember the month of birth of their child accurately. The number of births reported in the reference period can then be prorated to produce an estimate of annual births. Rates can be calculated both in this way and based on a 12-month reference period and the results compared.
The third scenario in Table 1 does not permit the derivation of a completely accurate measure of fertility, as the age of the mother at the birth of the child cannot be established precisely. However, knowledge of the child’s date of birth does permit the numerator of the age-specific fertility rates to be derived more carefully.
In the commonly-encountered situation where the question asked is about the month and year of the last child’s birth, a more careful approach can be taken to determining the number of births in the last year. Usually a notional census date is defined. The questions on the census questionnaire typically refer to a particular day, even if the actual process of enumeration takes several weeks. A list of census dates for the last three rounds of censuses is maintained by the UN at https://unstats.un.org/unsd/demographic-social/census/censusdates a list of census dates for data maintained by IPUMS is available at https://international.ipums.org/international-action/sample_details.
In establishing the numerator, all the births reported in the month of the census, and a prorated proportion of births that are reported to have occurred in the equivalent month a year earlier should be included. To extract this information from census data, the date handling capacity of the statistical package being used, or the DHS Century-Month Code (CMC) system can be used.
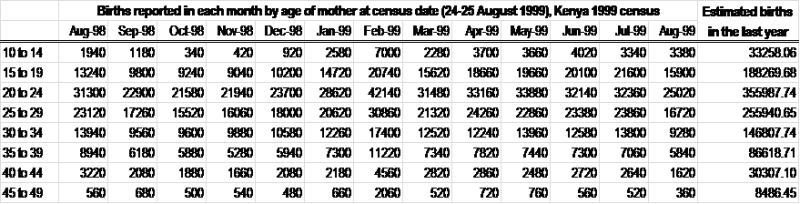
Table 4 Births reported in each month by age of mother at census date (24-25 August 1999), Kenya, 1999 Census
|
|
Age of mother at census |
||||||
|
Month |
15-19 |
20-24 |
25-29 |
30-34 |
35-39 |
40-44 |
45-49 |
|
August 1998 |
13,240 |
31,300 |
23,120 |
13,940 |
8,940 |
3,220 |
560 |
|
September 1998 |
9,800 |
22,900 |
17,260 |
9,560 |
6,180 |
2,080 |
680 |
|
October 1998 |
9,240 |
21,580 |
15,520 |
9,600 |
5,880 |
1,880 |
500 |
|
November 1998 |
9,040 |
21,940 |
16,060 |
9,880 |
5,280 |
1,660 |
540 |
|
December 1998 |
10,200 |
23,700 |
18,000 |
10,580 |
5,940 |
2,080 |
480 |
|
January 1999 |
14,720 |
28,620 |
20,620 |
12,260 |
7,300 |
2,180 |
660 |
|
February 1999 |
20,740 |
42,140 |
30,860 |
17,400 |
11,220 |
4,560 |
2,060 |
|
March 1999 |
15,620 |
31,480 |
21,320 |
12,520 |
7,340 |
2,820 |
520 |
|
April 1999 |
18,660 |
33,160 |
24,260 |
12,240 |
7,820 |
2,860 |
720 |
|
May 1999 |
19,660 |
33,880 |
22,860 |
13,960 |
7,440 |
2,480 |
760 |
|
June 1999 |
20,100 |
32,140 |
23,380 |
12,580 |
7,300 |
2,720 |
560 |
|
July 1999 |
21,600 |
32,360 |
23,860 |
13,800 |
7,060 |
2,640 |
520 |
|
August 1999 |
15,900 |
25,020 |
16,720 |
9,280 |
5,840 |
1,620 |
360 |
|
Estimated births in the last year |
188,269.68 |
355,987.74 |
255,940.65 |
146,807.74 |
86,618.71 |
30,307.10 |
8,486.45 |
|
Number of women |
1,700,060 |
1,495,180 |
1,205,060 |
849,620 |
725,780 |
519,740 |
417,500 |
|
Age-specific fertility rates |
0.1107 |
0.2381 |
0.2124 |
0.1728 |
0.1193 |
0.0583 |
0.0203 |
In the 1999 Kenya Census, the official census date was the night of 24-25 August 1999. To estimate the births that occurred in the year preceding the census, all births reported between September 1998 and August 1999 would be included, along with 1-24/31 (=7/31) of the births reported in August 1998. This assumes that births are uniformly distributed over the days of a month (Table 4).
The estimated number of births in the year before the census in the 30-34 age group, for example, is then given by
In the absence of further information about the mother’s date of birth, the data above are tabulated according to the mother’s age at the census date. As noted above, the rates so derived would thus be subject to a half-year shift.
Dividing these births by the number of women in each age group gives the age-specific fertility rates. The resulting estimate of total fertility of 4.66 children per woman is clearly out of line with other estimates of fertility in the country for around that time. This, as with Cambodia, suggests that widespread underreporting occurred of births reported in the year before that census.
Only in the fourth case, when detailed information is available on both mother and child’s date of birth, is it possible to produce a precise measurement of fertility. However, if there is evidence of extreme heaping of reported dates of birth (for example on 1 January), there is little point in making use of the more refined measures as they will be distorted by the heaping. Thus, since the quality and internal consistency of the data collected in a census are unlikely to be as good as in a DHS, it is inappropriate to attempt the precise calculation of fertility rates that one would with a DHS. In some situations, however, the extent of heaping in the reported dates of birth and other errors in the data may be sufficiently limited to merit calculation of direct estimates of fertility. In these situations, the principles outlined for the calculation of estimates of recent fertility from survey data should be applied.
References
Moultrie, Tom A. and Ian M. Timæus. 2002. Trends in South African Fertility between 1970 and 1998: An Analysis of the 1996 Census and the 1998 Demographic and Health Survey. Cape Town: Medical Research Council. https://www.mrc.ac.za/sites/default/files/attachments/2022-08/trends.pdf. Accessed: 17 October 2024..
For example, in the Kenya 1999 census, the official census date was the night of 24-25 August 1999. To estimate the births that occurred in the year preceding the census, all births reported between September 1998 and August 1999 would be included, along with 1-24/31 (=7/31) of the births reported in August 1998, on the assumption that births are uniformly distributed over the days of a month.
Note that, in the absence of further information about the mother’s date of birth, the data above is still tabulated according to the mother’s age at the census date, and the rates so derived would still be subject to a half-year shift, as with the other methods described above.
- Printer-friendly version
- Log in to post comments