Estimation of fertility by reverse survival
Description of method
Reverse survival is a method for estimating fertility from data collected in a census or single-round survey that can be used even if no questions have been asked about fertility directly. In a population closed to migration, the population of any age x are the survivors of the births in that population x completed years previously. This implies that the number of births occurring x years ago can be calculated, provided that one can estimate the life table survival probabilities from birth to age x (that is, )
"Reverse surviving" the population to its birth year and dividing by an estimate of the total population in that year gives the crude birth rate, while dividing by an estimate of women of childbearing age gives the General Fertility Ratio. By combining reverse survival estimates of past births and women according to age with estimates of, or a reasonable assumption about, the age pattern of fertility, one can also estimate Total Fertility.
Asking about births in the last year or the date of women’s last live birth only provides an estimate of current fertility. In contrast, reverse survival methods can provide estimates of fertility for the last 15 years. Moreover, unlike fertility estimates from birth histories, which are usually collected only from women aged 15 to 49, fertility estimates produced by reverse survival do not become increasingly truncated at older ages as they are calculated for more distant periods. So long as a single-year age distribution of children is available, the approach can produce an annual series of fertility estimates. In practice though, the data on age collected in developing countries are seldom sufficiently accurate to yield an undistorted time series.
Caveats and warnings
The methods described here depend heavily on the accuracy of the reported age distribution of the population being investigated. Errors in the age distribution, such as omission of infants and young children and heaping of reports on particular ages, can have a significant impact on the results derived. As Manual X notes, "because these types of deficiencies are all too frequently characteristic of the data sets available, reverse survival methods are often ineffective in producing reliable fertility estimates. Their usefulness depends mainly upon the fact that they often provide independent fertility estimates which can be used to assess the plausibility of those obtained by other means" (UN Population Division 1983: 178).
Under-enumeration of infants and young children is common in censuses and surveys in less developed countries. Such under-enumeration of children, especially those aged 2 or less, will result in estimates of fertility that are proportionally too low. Thus, reverse survival methods tend to underestimate current fertility and to produce an exaggerated impression of recent fertility decline.
In addition, inaccurate age reporting, in particular heaping of reports on preferred ages, may result in very erratic time series of estimates of fertility.
Before applying any reverse survival method of estimating fertility, investigations into the quality of the age and sex data should be undertaken. The methods should be applied with caution where the data are deemed to be of poor quality.
Although it is possible, it is generally inadvisable to produce reverse survival estimates of fertility going back more than 15 years before the inquiry concerned. The first reason for this is that both migration and differential under-enumeration are likely to distort estimates based on the age distribution of young adults aged 15 or more. Second, more distant estimates of fertility become increasingly dependent on accurate assessment of the mortality of older women.
Since the results depend on what is assumed about survivorship, they are fairly insensitive to assumptions made about the mortality of either children or women aged less than 65. For example, if the probability of having died of a child born about 12 years ago was 20 per cent and was under-estimated by a quarter at 16 per cent, then the resulting overestimate of the number of births would be (100 - 16)/(100 - 20), which is only 5 per cent. Similarly, even if the child had an older mother, her probability of having died would seldom be much greater than 20 per cent. If this probability was underestimated by a quarter, fertility would be overestimated by only 4.8 per cent. Moreover, if the bias in the mortality estimates is in the same direction for both children and mothers, the resulting errors in the estimates of fertility will partly cancel out.
Method 1: Estimation of the Crude Birth Rate for five-year periods
Data requirements and assumptions
Tabulations of data required
To derive average birth rates for five-year periods preceding an inquiry, the following data are required:
- enumerated population aged less than age 15, classified by five-year age group;
- total population enumerated either at two points in time or at a single point in time, together with an estimate of the growth rate; and
- estimated life table measures of survivorship for children, 5L0, 5L5 and 5L10.
Important assumptions
The population is assumed to have been closed to migration for as many years as are covered by the reverse survival estimates. However, because children usually migrate with their mothers, errors in the numerator and denominator of the estimated rates largely cancel out. Significant bias will result only if migration flows are large and migrants have different fertility from the rest of the population.
Application of method
Step 1: Calculate the life table survivorship of children
In order to reverse survive the population in the three age groups 0-4, 5-9 and 10-14, one needs only values of 5L0 , 5L5, and 5L10, the person-years lived by the stationary population between birth and age 5, and between ages 5 and 10, and 10 and 15, respectively. The source for these measures might be an empirically-based life table for the population under study or a model life table that is believed to be appropriate (for example, one of the Princeton regional model life tables). Given the high degree of aggregation across ages, one can assume that mortality is constant within each five-year period of time preceding the inquiry. Overestimates of mortality will produce overestimates of fertility (as they imply that the enumerated population represents the survivors of a relatively large cohort of births) and vice versa.
Since mortality changes rapidly in the first year of life, if an empirical life table is used, 5L0 should be calculated as 5L0 = 1L0 + 4L1. Should the empirical life tables be sex-specific, a combined-sex life table should be derived for ages 0 to 14 by assuming an appropriate sex-ratio at birth. This is achieved by means of the formula
where and are the life table values of lx for boys and girls respectively, and S0 is the sex ratio at birth (expressed as the number of male births per 100 female births).
If a model life table is used to represent mortality in childhood, 5L0 , 5L5, and 5L10 are obtained by interpolation of appropriate values from the tabulated series of models.
Step 2: Estimate the mid-period populations
In order to estimate an annual birth rate for up to three preceding periods of five years each, an estimate of the total population at the mid-point of each of the three periods is required. In the absence of detailed information that can be used directly (for example, the results of a census conducted 10 years earlier), and given the inherent loss of precision introduced by aggregating both population counts and mortality into five-year groups, obtaining a precise estimate is unnecessary. The easiest way to estimate the total population d years before an inquiry, N(t-d), where d = 2.5, 7.5 and 12.5, is to assume a constant rate of growth, r, and apply this to the population enumerated at time t, N(t), i.e.
The growth rate, r, can be estimated from information on the size of the total population, P, at two points in time, t0 and t1, such that
Thus, for example, the population 2½ years before the more recent inquiry is
N(t-2.5)= N(t).exp(-2.5r)
and similarly for the estimates of the population at other points in time.
Step 3: Estimate births in each five-year period preceding the inquiry
Define B(t - 5,t) to be the number of births that occurred each year in the period t - 5 to t years before an inquiry where t=0, 5 or 10. Define also 5Nx(t) to be the enumerated population aged between x and x + 5 at the date of the inquiry. It follows that the average number of births in each of the five years from t-5 to t is
B(t-5,t) = 5N0(t).l0/5L0
B(t-10,t-5) = 5N5(t).l0/5L5
and
B(t-15,t-10) = 5N10(t).l0/5L10
The crude birth rate for each period is then calculated by dividing the number of births in each period by the corresponding mid-period populations from Step 2
and similarly for the earlier periods.
Worked example
The basic principles of reverse-survival estimation of fertility are illustrated here using data from the Census conducted in Cambodia in 2008.
Step 1: Calculate the life table survivorship of children
Survival factors are derived from the World Health Organization life table for Cambodia for 2000. Values of nLx for both sexes in this life table are shown in Table 1 for a radix of 100,000.
Table 1 Extracted values from WHO life table for Cambodia, 2000
Age | n | x | lx | dx | nLx |
|---|---|---|---|---|---|
<1 | 1 | 0 | 100,000 | 7,956 | 94,431 |
1-4 | 4 | 1 | 92,044 | 2,684 | 361,734 |
5-9 | 5 | 5 | 89,360 | 887 | 444,581 |
Based on these data, one can calculate the following quantities
Step 2: Estimate the mid-period populations
Using the samples from Cambodian censuses provided by IPUMS International, the population of Cambodia on 3 March 1998 was 11,412,540 people. By the same date in 2008, it was 13,401,210. The population under the age of 5 in 2008 was 1,736,790 and that aged between 5 and 10 was 1,472,470.
Since the censuses were conducted exactly ten years apart, the intercensal growth rate is calculated as per cent per annum.
The population 2.5 and 7.5 years before the second census is therefore estimated to be
Step 3: Estimate births in each five-year period preceding the inquiry
The estimated number of births in each of the five years before the census is given by
B(t-5,t) = 1,736,790 × 0.21922 = 380,739.
For the five years before that, it is
B(t-10,t-5) =1,472,471 × 0.22493 = 331,202.
Dividing the births by the estimated mid-period population yields crude birth rates for Cambodia of 29.6 births per 1000 in the period 2003-2008, and 27.9 births per 1000 in the period 1998-2003.
These figures are of the right order of magnitude: the US Census Bureau estimates the crude birth rate in the country as 28 in 2000 and 27 in 2005, while the UN Population Division’s estimate for 2000-2005 is 25.1 births per 1000. Note, however, that the reverse survival estimates suggest that a slightly rise in fertility occurred during the 1990s. This finding could well be spurious and might result from errors in the initial estimates of the population or an inappropriate choice of life table.
Method 2: Estimation of General Fertility and Total Fertility Ratios
The second application of the concept of reverse survival described here produces annual estimates of the General Fertility and Total Fertility Ratios for up to 15 years before the inquiry. To calculate the General Fertility Ratio requires only that one estimates the past size of the population of adult women from the number of women enumerated in an inquiry by allowing for adult mortality. To calculate Total Fertility, however, requires information not only on the number of births occurring each year, but also on the ages of the mothers of these newborn children. One relatively simple way of estimating this information, if it is not known, is to apportion births to age groups of mother using independent estimates of the age distribution of fertility.
Data requirements and assumptions
Tabulations of data required
To derive General Fertility Ratios for individual years, the following data are required:
- Tabulations of the population (of both sexes) aged 0 to 14, by single years of age.
- Tabulations of the female population aged 15 to 64 by five-year age group.
- Cohort survival probabilities, Lx, for children aged 0 to 14 of both sexes.
- Survivorship ratios, 5Lx-5/5Lx for adult women for each of the three five-year periods preceding the inquiry.
In respect of the mortality estimates, the implementation of the method in the associated Excel workbook allows these to be specified either by reference to period-specific parameters α and β of appropriate relational model life tables, or to identified values of 5q0 (for children) and 45q15 (for adult women) for each of the three five-year periods preceding the enquiry.
To produce estimates of Total Fertility, one also requires either
- A single age-specific fertility distribution that is assumed to apply to the entire period covered by the estimates, or
- Two age-specific fertility distributions, one of which applies to a date reasonably close to the index inquiry and the other to a date approximately 15 years prior to that.
Either a series of fertility rates or the parameters of a relational Gompertz model fitted to a standard fertility schedule can be used as an input to the calculations.
Note that only the estimated shape of the fertility distribution is based on these fertility schedules. It is the estimated number of births relative to the population of women of childbearing age that almost entirely determines the estimates of the General and Total Fertility Ratios.
Important assumptions
The population is assumed to have been closed to migration for as many years as are covered by the reverse survival estimates. However, because children usually migrate with their mothers, errors in the numerator and denominator of the estimated rates largely cancel out. Significant bias will result only if migration flows are large and migrants have different fertility from the rest of the population.
Application of method
Step 1: Estimate the number of births in each year before the inquiry
The enumerated population aged x in any inquiry represents the survivors from the births that occurred in the 12-month period centred on the date x+0.5 years before the inquiry. Algebraically,
The measure of survivorship used in this calculation, cLx, is a cohort survival factor. It depends on mortality at successive ages in successive years leading up to the inquiry. Appropriate cohort estimates of mortality may be available from the inquiry used to estimate fertility. Such estimates include indirect estimates from children ever-born and surviving data, in the case of a census, and direct estimates from a cohort analysis of the birth histories, in the case of a fertility survey. Brass (1979) describes a simple procedure for estimating Lx directly from proportions of children surviving according to their mothers’ age group.
If a series of cohort survival ratios is not readily to hand, one can be derived from estimates of period mortality by single years of age for each five-year period before the inquiry.
Working with a relational logit system of model life tables, define αT and βT to be the parameters that generate a life table for period T, where T=0 refers to the period 0-4 years before the inquiry, T=5 to the period 5-9 years before the inquiry and T=10 to the period 10-14 years before the inquiry. For a given standard, indexed by the superscript s,
where Y is the logit function:
(Equation 1)
and l(x) or (xp0) refers to the proportion surviving from birth to exact age x in a life table with a radix of 1. Equation 1 implies that
and that
(Equation 2)
At ages other than infancy, one can approximate Lx,T, the person-years lived between x and x + 1 in period T by assuming that survivorship declines linearly on the logistic scale and, therefore, that the logit of Lx,T is the average of Yx,T and Yx+1,T. From Equation 2
(Equation 3)
The values of l(x) in systems of model life tables are often tabulated by single ages up to age 5, and then at every fifth year of age. If this is the case for children aged 5 or more, one can assume that logit survivorship declines linearly over the entire age range x to x+5. Thus, for example, if a life table has tabulated values at x=5 and x=10, the estimated value of L9,T would be given by
For infants, one should allow for the concentration of deaths in the first days and weeks of life. In medium and high mortality populations, one can approximate person years lived in the first year of life as
(Equation 4)
Survivorship ratios from one age to the next, Px,T, in time period T, are derived from the ratio of successive values of Lx,T:
(Equation 5)
Once estimates of the survivorship of children by single years of age and five-year time periods have been obtained in either the way just outlined or by some other procedure, an estimate of cohort survivorship by single years of age for single-year age cohorts can be calculated as follows. Recall that Pa,T is the survivorship ratio between ages a and a+1 in time period T (where T=0, 5 or 10, corresponding to five-year periods 0-4, 5-9 and 10-14 years before the inquiry). Further define Sa,t to be the survivorship ratio between ages a and a+1 in the period t to t + 1 years before the inquiry, 0 ≤ t ≤ 14. Using linear interpolation to estimate survivorship for the intermediate years
The proportion of births occurring x to x+1 years earlier that survive to the time of the inquiry, cLx, can then be calculated as
(Equation 6)
The number of births in each year before an inquiry, centred on the point mid-way through that year (i.e. 6 months before the date of the inquiry), is thus
where Nx is the number of children aged x reported in the inquiry.
Step 2: Estimate the mid-year populations of women by five-year age group
The calculation of survivorship for women aged 15 to 64 at the date of the inquiry can be done in a straightforward way because mortality is usually fairly low in the central adult ages. Thus, even approximate estimates of mortality will enable one to produce a satisfactory estimate of the past population from the enumerated population.
The absolute variation of mortality with age within any five-year age group is small. Therefore, one can therefore approximate 5Lx by linear interpolation between Yx and Yx+5. This means that one can estimate survivorship between five-year age groups at time T (where T= 5, 10 and 15) as
(Equation 7)
Starting with the population enumerated at T = 0, the number of women in each five-year age group T + 5 years before the inquiry can then be calculated from the number at T:
(Equation 8)
Furthermore, since the age structure of a population changes only slowly, the mid-year populations of women in the age groups 10-14, 15-19, … , 60-64 for each year before the date of the inquiry can be estimated by interpolating linearly between the population estimates for 0, 5, 10 and 15 years before the inquiry produced by Equation 8. For example, to estimate the number of women aged 20-24 at the point 8½ years before the inquiry, the formula would be
Step 3: Derive General Fertility Ratios
The General Fertility Ratio for the year centred on the point x-0.5 years before the inquiry is
(Equation 9)
where the denominator is the total number of women aged between 15 and 49 at the mid-point of the year during which the births occurred.
Step 4: Estimate age-specific and Total Fertility
A natural extension to the calculation of General Fertility Ratios is to make use of a schedule describing the age-pattern of fertility in the population being studied to estimate Total Fertility by a procedure akin to indirect standardization.
Such a fertility schedule might come from data on recent births collected in the same inquiry as is being analyzed by reverse survival methods. As only information on the age pattern of fertility is obtained from these data, no need exists to adjust the reports for reference-period errors. If a second fertility schedule is available from a previous census or survey of the same population (preferably conducted about 15 years earlier) one can interpolate between the two schedules, or if necessary extrapolate, to estimate the shape of the fertility schedule in each year for which one intends to estimate Total Fertility.
However, even if one suspects that fertility has been changing, having two schedules is not essential, since the age pattern of fertility evolves only gradually and estimates of Total Fertility are not very sensitive to the exact assumptions made about the shape of the fertility distribution. Thus, a single schedule (preferably referring to about the middle of the estimation period) will suffice.
If fertility has been estimated using a relational Gompertz model, in combination with the chosen standard, the parameters α and β derived during the estimation of fertility define the shape of the fertility schedule. Accordingly, values of α and β can be used to determine the shape of the fertility schedule(s) used in the estimation of Total Fertility.
Once one has estimated the proportion of Total Fertility occurring in each age group can for each year before the inquiry, these proportions can be applied to the population of women in each age group in each year to estimate the number of births that would have occurred to women in that age group if Total Fertility equalled one child per woman.
Thus, once one has selected a fertility schedule (scaled to a Total Fertility of 1), 5f*a,x+0.5, for each age group (a=15, 20,…, 45) for each of the 15 years (x) before an inquiry, the expected number of births to women in each age group in each year is given by
It follows that the total number of births that would have occurred in year x if Total Fertility had equalled 1 is
However, Step 2 yielded an estimate of the actual number of births in each year, Bx+0.5. The estimate of Total Fertility for each year is thus the ratio of B to B*
Estimates of the age-specific fertility rates for the year can be produced by multiplying the proportional rates, 5f*a,x, for each age group (a) and year (x) by the estimate of Total Fertility for that year. It should be noted, however, that the results will merely reproduce the age pattern of fertility that was input into the calculations: this method provides no new information on the age pattern of fertility.
Worked example
The worked example, implemented in an accompanying Excel workbook, estimates fertility trends in Cambodia from the 2008 census. Sample microdata are available from IPUMS International and the reference date for the census was 3 March 2008. In decimal notation, this date corresponds to 2008.17.
The numbers of children aged less than 15 by single years of age, and the numbers of women aged 10 to 64 in five-year age groups extracted from the data are shown in Table 2.
Table 2 Numbers of children by single year of age, and women by five-year age group, Cambodia, 2008 Census
Age | Children | Age group | Women |
|---|---|---|---|
0 | 281,260 | 10-14 | 815,930 |
1 | 261,320 | 15-19 | 780,320 |
2 | 268,410 | 20-24 | 697,160 |
3 | 286,810 | 25-29 | 626,430 |
4 | 278,990 | 30-34 | 361,650 |
5 | 293,760 | 35-39 | 435,880 |
6 | 293,490 | 40-44 | 393,760 |
7 | 302,060 | 45-49 | 352,520 |
8 | 315,970 | 50-54 | 294,280 |
9 | 267,190 | 55-59 | 230,200 |
10 | 326,980 | 60-64 | 160,590 |
11 | 280,260 | ||
12 | 354,120 | ||
13 | 356,920 | ||
14 | 354,830 |
Mortality for the five-year period before the census was taken from the 2009 WHO life tables for Cambodia. The proportion surviving to exact age x, together with the associated logits for children aged less than 15 of both sexes and for women aged 10 to 65 are shown in Table 3.
Table 3 WHO life table for Cambodia in 2009 used as standard
Children | l(x) | Logit, Y(x) |
|---|---|---|
0 | 1.0000 | |
1 | 0.9320 | -1.3085 |
5 | 0.9125 | -1.1723 |
10 | 0.9048 | -1.1256 |
15 | 0.8997 | -1.0968 |
Women | ||
10 | 0.9138 | -1.1805 |
15 | 0.9099 | -1.1561 |
20 | 0.9049 | -1.1266 |
25 | 0.8980 | -1.0875 |
30 | 0.8889 | -1.0399 |
35 | 0.8760 | -0.9774 |
40 | 0.8603 | -0.9089 |
45 | 0.8419 | -0.8361 |
50 | 0.8179 | -0.7511 |
55 | 0.7847 | -0.6467 |
60 | 0.7374 | -0.5161 |
65 | 0.6732 | -0.3613 |
This life table was used as a standard against which to fit relational model life tables for children and adults separately for the periods 5-9 and 10-14 years before the census to the WHO life tables for Cambodia for 2000 and 1990. The fitted values of α and β for children and adults are shown in Table 4.
Table 4 Parameters of relational model life tables for five-year periods before the 2008 Census, using the 2009 WHO life table for Cambodia as the standard
|
| Period before the census (years) | ||
|---|---|---|---|---|
|
| 0-4 | 5-9 | 10-14 |
Children | α | 0.0000 | 0.2165 | 0.3533 |
| β | 1.0000 | 1.0979 | 1.1723 |
|
|
|
|
|
Adults | α | 0.0000 | 0.0815 | -0.0031 |
| β | 1.0000 | 0.9690 | 0.8673 |
Estimates of age-specific fertility for mid-1997 and mid-2007 were obtained from the UN Population Division’s World Population Prospects (2010 revision) and are shown in Table 5.
Table 5 Fertility schedules for Cambodia used in the reverse survival estimation
Year | ||
|---|---|---|
Age group | 1997.5 | 2007.5 |
15-19 | 0.053 | 0.042 |
20-24 | 0.197 | 0.154 |
25-29 | 0.214 | 0.148 |
30-34 | 0.184 | 0.112 |
35-39 | 0.133 | 0.071 |
40-44 | 0.068 | 0.030 |
45-49 | 0.013 | 0.003 |
Step 1: Estimate the number of births in each year before the inquiry
Applying Equations 3 and 4 to the logit values of the standard presented in Table 3, using the values of α and β in Table 4, gives the estimates of Lx,T and Px,T presented in Table 6.
Table 6 Calculation of cohort survival ratios by age, Cambodia 1983-2008
x | Lx,0 | Lx,5 | Lx,10 | Px,0 | Px,5 | Px,10 | cLx |
|---|---|---|---|---|---|---|---|
0 | 0.9524 | 0.9439 | 0.9397 | 0.9524 | 0.9439 | 0.9397 | 0.9524 |
1 | 0.9298 | 0.9170 | 0.9106 | 0.9763 | 0.9716 | 0.9691 | 0.9298 |
2 | 0.9252 | 0.9112 | 0.9039 | 0.9951 | 0.9936 | 0.9926 | 0.9252 |
3 | 0.9197 | 0.9041 | 0.8958 | 0.9941 | 0.9923 | 0.9910 | 0.9181 |
4 | 0.9145 | 0.8974 | 0.8881 | 0.9944 | 0.9926 | 0.9914 | 0.9104 |
5 | 0.9118 | 0.8939 | 0.8840 | 0.9970 | 0.9960 | 0.9954 | 0.9049 |
6 | 0.9102 | 0.8919 | 0.8818 | 0.9983 | 0.9978 | 0.9974 | 0.9003 |
7 | 0.9087 | 0.8899 | 0.8795 | 0.9983 | 0.9978 | 0.9974 | 0.8954 |
8 | 0.9071 | 0.8879 | 0.8771 | 0.9983 | 0.9977 | 0.9973 | 0.8911 |
9 | 0.9056 | 0.8858 | 0.8747 | 0.9983 | 0.9977 | 0.9973 | 0.8871 |
10 | 0.9043 | 0.8842 | 0.8728 | 0.9986 | 0.9981 | 0.9978 | 0.8834 |
11 | 0.9033 | 0.8828 | 0.8713 | 0.9989 | 0.9985 | 0.9983 | 0.8801 |
12 | 0.9022 | 0.8815 | 0.8698 | 0.9989 | 0.9985 | 0.9983 | 0.8767 |
13 | 0.9012 | 0.8802 | 0.8682 | 0.9989 | 0.9985 | 0.9982 | 0.8741 |
14 | 0.9002 | 0.8789 | 0.8667 | 0.9989 | 0.9985 | 0.9982 | 0.8719 |
Cohort survival to the census date of children aged 0 to 14 is then estimated using Equations 5 and 6 (presented in the last column of Table 6).
Finally, the number of births in each year preceding the census is derived by dividing the number of children enumerated in 2008 at each age by the relevant value of cLx. (Table 7).
Table 7 Estimated number of births in each of the 15 years preceding the 2008 census, Cambodia
Mid-year preceding the census date | Births |
|---|---|
2007.67 | 295,328 |
2006.67 | 281,062 |
2005.67 | 290,118 |
2004.67 | 312,409 |
2003.67 | 306,453 |
2002.67 | 324,644 |
2001.67 | 325,997 |
2000.67 | 337,355 |
1999.67 | 354,583 |
1998.67 | 301,184 |
1997.67 | 370,118 |
1996.67 | 318,451 |
1995.67 | 403,924 |
1994.67 | 408,337 |
1993.67 | 406,976 |
Step 2: Estimate the mid-year populations of women by five-year age group
Applying the values of α and β for adult women in each five-year period given in Table 4 to the standard logits in Table 3 produces (by means of Equation 7) the five-year survivorship ratios for women by five-year age group shown in Table 8.
Table 8 Survival factors, 5Px,T , by five-year age group and period before the Census, Cambodia 1993-1998
Age group | T=0 | T=5 | T=10 |
|---|---|---|---|
10-14 | 0.9951 | 0.9942 | 0.9945 |
15-19 | 0.9935 | 0.9922 | 0.9927 |
20-24 | 0.9912 | 0.9895 | 0.9902 |
25-29 | 0.9878 | 0.9855 | 0.9866 |
30-34 | 0.9838 | 0.9810 | 0.9826 |
35-39 | 0.9804 | 0.9772 | 0.9793 |
40-44 | 0.9752 | 0.9714 | 0.9744 |
45-49 | 0.9658 | 0.9609 | 0.9654 |
50-54 | 0.9501 | 0.9438 | |
55-59 | 0.9271 |
Application of the survivorship ratios from Table 8 to the enumerated population of women aged 10 to 64 using Equation 8 produces estimates of the population of women by five-year age group for 5, 10 and 15 years before the census (Table 9).
Table 9 Number of women by five-year age group 0, 5, 10 and 15 years before the 2008 Cambodia Census
Age group | 2008.17 | 2003.17 | 1998.17 | 1993.17 |
|---|---|---|---|---|
10-14 | 815,930 | 784,134 | 705,852 | 640,512 |
15-19 | 780,320 | 701,746 | 636,977 | 372,754 |
20-24 | 697,160 | 632,014 | 370,014 | 454,008 |
25-29 | 626,430 | 366,133 | 449,548 | 414,964 |
30-34 | 361,650 | 443,047 | 409,395 | 376,470 |
35-39 | 435,880 | 401,624 | 369,909 | 320,300 |
40-44 | 393,760 | 361,474 | 313,672 | 258,772 |
45-49 | 352,520 | 304,701 | 252,137 | 190,119 |
50-54 | 294,280 | 242,285 | 183,546 | |
55-59 | 230,200 | 173,224 | ||
60-64 | 160,590 |
It is a straightforward arithmetic exercise to linearly interpolate between the right-hand four columns of Table 9 for each age group to produce estimates of the population by five-year age group for the 15 years centred on dates 6, 18, 30 ... 174 months before the census, which is to say for 2007.67, 2006,67 … 1993.17. An extract of the results is shown in Table 10.
Table 10 Number of women by five-year age group by year
Age group | 2007.67 | 2006.67 | 2005.67 | 2004.67 | 2003.67 | 2002.67 |
|---|---|---|---|---|---|---|
10-14 | 812,750 | 806,391 | 800,032 | 793,672 | 787,313 | 776,305 |
15-19 | 772,463 | 756,748 | 741,033 | 725,318 | 709,604 | 695,269 |
20-24 | 690,645 | 677,616 | 664,587 | 651,558 | 638,528 | 605,814 |
25-29 | 600,400 | 548,341 | 496,281 | 444,222 | 392,162 | 374,474 |
30-34 | 369,790 | 386,069 | 402,349 | 418,628 | 434,907 | 439,682 |
35-39 | 432,454 | 425,603 | 418,752 | 411,901 | 405,050 | 398,453 |
40-44 | 390,531 | 384,074 | 377,617 | 371,160 | 364,703 | 356,694 |
45-49 | 347,738 | 338,174 | 328,610 | 319,046 | 309,483 | 299,444 |
Step 3: Derive General Fertility Ratios
General Fertility Ratios for each year are calculated using Equation 9, the births from Table 7 and the population of women aged 15 to 49 (from Table 10).
Table 11 Estimates of the General Fertility Ratio (per 1000 women), Cambodia, 1993-2008
Mid-Year | GFR (15-49), per 1000 |
|---|---|
2007.67 | 82 |
2006.67 | 80 |
2005.67 | 85 |
2004.67 | 93 |
2003.67 | 94 |
2002.67 | 102 |
2001.67 | 106 |
2000.67 | 112 |
1999.67 | 121 |
1998.67 | 106 |
1997.67 | 134 |
1996.67 | 119 |
1995.67 | 156 |
1994.67 | 163 |
1993.67 | 168 |
Step 4: Estimate age-specific and Total Fertility
Interpolating between the two fertility schedules in Table 5, fertility distributions – assuming Total Fertility of one child per woman – can be calculated for successive periods of a year preceding the census. An extract of the series, illustrating a portion of the calculations, is shown in Table 12.
Table 12 Interpolated fertility distributions by five-year age group and year
| Age group | 2007.67 | 2006.67 | 2005.67 | 2004.67 | 2003.67 | 2002.67 |
|---|---|---|---|---|---|---|
| 10-14 | 0.0000 | 0.0000 | 0.0000 | 0.0000 | 0.0000 | 0.0000 |
| 15-19 | 0.0150 | 0.0147 | 0.0145 | 0.0142 | 0.0139 | 0.0137 |
| 20-24 | 0.0550 | 0.0541 | 0.0532 | 0.0523 | 0.0514 | 0.0505 |
| 25-29 | 0.0530 | 0.0527 | 0.0524 | 0.0520 | 0.0517 | 0.0514 |
| 30-34 | 0.0399 | 0.0402 | 0.0404 | 0.0407 | 0.0410 | 0.0412 |
| 35-39 | 0.0252 | 0.0258 | 0.0263 | 0.0269 | 0.0274 | 0.0280 |
| 40-44 | 0.0107 | 0.0112 | 0.0117 | 0.0122 | 0.0126 | 0.0131 |
| 45-49 | 0.0011 | 0.0013 | 0.0015 | 0.0017 | 0.0019 | 0.0021 |
For each year, multiplication of the number of women in each age group by the corresponding fertility distribution for that age group produces the estimated number of births in that age group if Total Fertility was one child per woman.
However, the number of births each year has been estimated already (Table 7). The ratios of those estimates to the estimates based on the assumption that Total Fertility was 1 represent estimates of actual Total Fertility in each year.
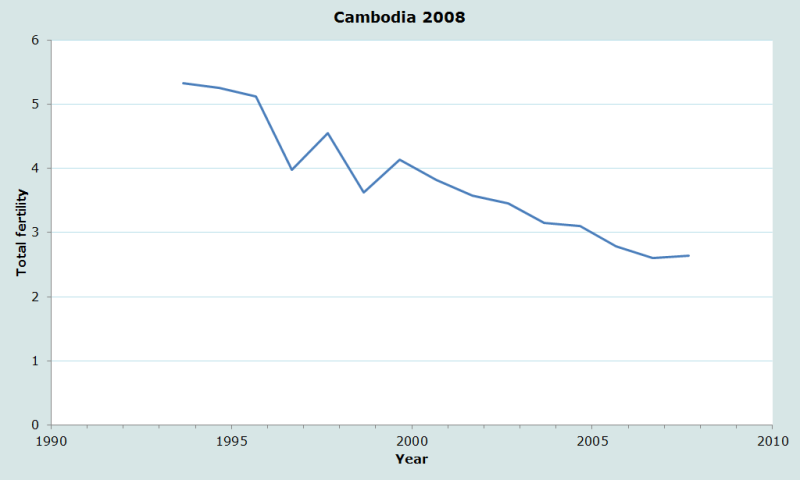
Table 13 Estimates of Total Fertility, Cambodia 1993-2007
Mid-Year | Total Fertility |
|---|---|
2007.67 | 2.65 |
2006.67 | 2.60 |
2005.67 | 2.78 |
2004.67 | 3.10 |
2003.67 | 3.16 |
2002.67 | 3.46 |
2001.67 | 3.58 |
2000.67 | 3.82 |
1999.67 | 4.14 |
1998.67 | 3.63 |
1997.67 | 4.56 |
1996.67 | 3.98 |
1995.67 | 5.13 |
1994.67 | 5.26 |
1993.67 | 5.33 |
Interpretation
The results of the application of reverse survival methods to data from the 2008 Census of Cambodia are plotted in Figure 1. The figure gives a strong visual sense of the progress of fertility decline in Cambodia over the 15-year period up to 2008. While the Crude Birth Rate estimated by Method 1 rose slightly between two five-year periods before the census, Total Fertility has continued to fall. Figure 1 also shows clearly the impact on the age structure, and thereby the estimates of fertility, of a preference for reporting children to be ages 8, 10 and 12, rather than 9 or 11.
In general, the main problems that are likely to arise with fertility estimates calculated by reverse survival methods stem not from the reverse survival procedure itself or from the assumptions made about the age pattern of fertility, but from age reporting errors or the failure of some respondents to report all young children who are household members. Omissions of young children and overestimation of their ages often produce a false impression that fertility decline has accelerated in the few years before the data were collected. No evidence exists that such reporting errors have occurred in Cambodia.
Because only a minority of children die during the 15 years after their birth, and in most contemporary populations quite a small minority of children at that, any errors in the assumptions made about children’s mortality have a less than proportional impact on the estimates of fertility. Overestimates of child mortality produce overestimates of past fertility and vice versa. As the proportion of children that have died increases with age, the impact of such errors tends to be greater for the more distant estimates, resulting in a slight bias in the estimated trend in fertility. It is often easier to determine whether such biases exist in the data if it is possible to plot multiple series of fertility estimates on one chart rather than just examining a single set of results, as in this illustrative analysis.
Extensions of the method
A well-established extension of reverse survival methods for estimating fertility is the Own-Children Method. The method has been documented comprehensively by Cho, Retherford and Choe (1986). The Own-Children Method also produces estimates of Total Fertility but, instead of using independent estimates of the age pattern of fertility to apportion births among mothers, seeks to link each child enumerated in an inquiry to his or her mother. This makes it possible to tabulate children by both their own age and the age of their mothers. These counts can then be reverse survived to calculate the number of children born each year in the past according to the age of their mothers then.
In inquiries in which detailed information has been collected on intra-household familial relationships and, in particular, if the identifier of co-resident mothers was added to the record for each child, this exercise in record linkage is somewhat algorithmically complex but do-able. Assumptions still need to be made about the age of the mothers of foster children and maternal orphans and, if they are numerous, it may be problematic to assume that they can be allocated to age groups of mothers on a pro rata basis (Timæus 2021).
If only limited information on relationships within the household is available, linking children to their mothers can become problematic, especially in populations where extended family households are common. In particular, if the mother is not resident in the household, children are at risk of being linked wrongly to an aunt, grandmother or other woman instead of remaining unlinked. The net impact of such errors is usually to inflate the estimated age-specific fertility of older women. Divorce, remarriage and polygynous marriage also increase the scope for identifying the wrong woman as the child’s mother.
It is impossible to offer advice here on the detailed algorithms that should be used to link children to mothers when applying the Own-Children Method for estimating fertility, as the procedure adopted should be tailored to exactly what questions were asked and what fieldwork procedures were followed. For example, linkage becomes more straightforward if interviewers were instructed to list simple family units within a household together rather than, for example, grouping household members by age or gender.
Because substantial numbers of young people leave home in their late teenage years (including, in most cultures, young women who marry), the recommendation that reverse survival methods should be used only to estimate fertility for the 15 years before the inquiry concerned applies particularly strongly to estimates produced using the Own Children Method.
Despite these potential limitations, experience suggests that the Own-Children Method can produce estimates of fertility of similar quality to those calculated from birth history data. Indeed, because they avoid the problem of truncation of the fertility rates for older women as the estimates move back in time and because birth history data must be collected from women personally and women who cannot be interviewed tend to have relatively lower fertility, it has been argued that estimates produced by the Own-Children Method are superior to direct estimates from birth histories in most instances (Avery, St. Clair, Levin et al. 2013).
Equally, the reverse survival methods described in detail here usually perform well at a national level. They do not require access to individual-level data files and may produce more accurate estimates than the Own Children Method in inquiries in which matches of children to the wrong putative mother are common.
The Own-Children Method is particularly appropriate, however, for the study of differential fertility according to attributes of the mother such as her education, residence, or marital status. Because it can be applied to census data, the Own-Children Method can be used to estimate the fertility of sub-groups of the population that are too small to study using fertility survey data. Moreover, because far more information on women’s attributes is usually collected in censuses than on birth certificates, the method remains of value even in countries with complete registration of births.
References
Avery C, T St. Clair, M Levin and K Hill. 2013. "The 'Own Children' fertility estimation procedure: A reappraisal", Population Studies 67(2): 171-183. https://dx.doi.org/10.1080/00324728.2013.769616
Brass W. 1979. "Evaluation of birth and death registration using age distributions and child survivorship data", Asian and Pacific Census Forum 5(3):9-11,20. https://hdl.handle.net/10125/3563
Cho LJ, RD Retherford and MK Choe. 1986. The Own-Child Method of Fertility Estimation. Honolulu: University of Hawaii Press.
Timæus IM. 2021. "The Own-Children Method of fertility estimation: The devil is in the detail", Demographic Research 45: 825-840. https:/dx.doi.org/10.4054/DemRes.2021.45.25
UN Population Division. 1983. Manual X: Indirect Techniques for Demographic Estimation. New York: United Nations, Department of Economic and Social Affairs, ST/ESA/SER.A/81. https://www.un.org/development/desa/pd/sites/www.un.org.development.desa.pd/files/files/documents/2020/Jan/un_1983_manual_x_-_indirect_techniques_for_demographic_estimation.pdf
We acknowledge the suggestion of improvements to Method 2 made by Thomas Spoorenberg of the United Nations to allow the incorporation of parameters from the 2015 World Population Prospects, and for his preparation of the necessary data files.
- Printer-friendly version
- Log in to post comments