Estimation of pregnancy-related mortality from survival of siblings
Description of method
The use of full sibling history data to estimate overall adult mortality, and the evaluation of such data, is described elsewhere. A full sibling history is analogous to a full birth history: a respondent (usually a female of reproductive age) is asked about each of her siblings born of the same mother. For surviving siblings, sex and age in completed years are recorded; for dead siblings, sex, age at death in completed years and calendar year of death are recorded. The resulting history is, with the addition of the respondent herself, the full birth history of the mother. As with a full birth history, the sibling history allows events (deaths) and exposure time to be arranged in calendar time, and hence the calculation of age-period mortality rates. For pregnancy-related mortality, further information is collected concerning deaths of sisters of reproductive age as to whether the sister died during pregnancy, during delivery, or in the 42 days (or sometimes 2 months) post-partum. This section focuses on analyzing information on sisters of reproductive age.
One important issue discussed under full sibling histories will be touched on here. The DHS full sibling history asks respondents for the full birth history of their natural mother, excluding themselves. As a result, there is the potential for multiple responses about the same individual. For example, if two daughters of the same mother are interviewed in the same household, there will be multiple reports about other members of the sibship. The DHS bases events and exposure time entirely on reported siblings, not taking into account the exposure time of the (surviving) respondent hersel. The events and exposure time of siblings are weighted only by the respondent’s sample weight, not taking into account numbers of surviving potential respondents in the sibship. Trussell and Rodriguez (1990) show that if there is no correlation between mortality risks within sibships, this calculation gives an unbiased estimate of overall mortality. Gakidou and King (2006) argue that sibships should include the surviving respondent and should in addition be weighted by the likelihood that they will be reported – that is, by the inverse of the number of potential respondents in the sibship. They also argue that an adjustment should be made for sibships that go unreported because no member remains alive. In a multi-survey analysis of DHS FSH’s, Obermeyer, Rajaratnam, Park et al. (2010) estimate that the effect of not adjusting for likelihood of reporting can bias overall mortality estimates downwards by 20 percent or so. Masquelier (2012) however argues that the Obermeyer et al. analysis took into account all surviving siblings, not just potential respondents, and as a result exaggerated the size of any bias. Masquelier recommends using the DHS calculation approach, for reasons outlined below (see also Sibling History Analysis).
Data requirements and assumptions
Important assumptions
- No correlation exists between mortality risks of women and size of sibship
- There are no selection effects resulting from migration
Tabulations of data required
- Number of women, by five-year age group from household questionnaire.
- Number of sister deaths by time period (typically 0-6 years) before the survey by five-year age group and by whether during pregnancy, delivery or 42 days/2 months post-partum.
- Number of sister-years of exposure by time period by five-year age group of respondent.
- Age-specific fertility rates and General Fertility Rate for the time period.
We will assume here that the DHS approach is followed. The extraction of summary data from the DHS is beyond the scope of this manual. A standard program exists in the free software CSPro to produce this tabulation from the basic data. A decision that has to be made at the outset of the analysis is the time frame to be used. Most DHSs create the basic table for events and exposure in the seven (0 to 6) years prior to the survey, but sometimes the period used is five years, and sometimes ten years. One consideration in choosing one period rather than another is sampling errors; in a small sample with quite low adult mortality, the period may have to be ten years to avoid very large sampling uncertainty, whereas with a large sample and higher mortality, the period may be reduced to five years. This aspect of the method is discussed further in the section on interpretation of results.
Preparatory work and preliminary investigations
Data quality assessment for a full sibling history and for recent age-specific fertility rates are described elsewhere. The only data quality assessment specific to the estimation of Pregnancy-Related Mortality is of the information on the proportion of deaths of women of reproductive age that are pregnancy-related, (PPRD), and the proportions of pregnancy-related deaths that occur during pregnancy, during delivery and in the 42 days (or two months) post-partum.
No formal methods exist for carrying out such assessments. However, the age pattern of the proportion of deaths that are pregnancy-related should resemble the age distribution of age-specific fertility, since it is births that are the risky events. Risks of pregnancy-related death are generally thought to be rather higher at the extremes of the reproductive age period, so the tails of the proportions pregnancy-related may be somewhat “fatter” than for age-specific fertility.
Caveats and warnings
It is widely believed that sibling histories tend to under-report mortality, particularly deaths further in the past. One should thus not attempt to interpret trends over time in pregnancy-related mortality from a single data set. Such attempts across data sets would also need to take into account the wide confidence intervals surrounding estimates even for a seven-year window.
Application of method
Step 1: Extract tabulations of the data
As mentioned earlier, software is readily available to extract the tabulations required relating to reported deaths of sisters, their exposure and pregnancy-related deaths. In addition, estimates of age-specific fertility are required. (If the data on sisters are extracted from a DHS, the approach to estimating fertility rates directly from the data is described elsewhere in this manual). Finally, an estimate of the female population by age group enumerated in the household survey is required. We define the following terms
- the reported number of sisters reported dying between ages x and x+5
- the number of person-years lived by sisters between ages x and x+5
- the number of pregnancy-related deaths of sisters between ages x and x+5
- age-specific fertility rates of women aged x to x+5
- the population of women aged between x and x+5 as enumerated in the survey
Tabulations of each of the above five quantities are required to implement the method.
Step 2: Derive measures of mortality
The age-specific mortality rate is derived by dividing the reported deaths of sisters by the number of person years lived by those sisters in each age group,
(Equation 1)
The age-specific pregnancy-related mortality rate in each age group is given by
(Equation 2)
The proportion of deaths that are pregnancy-related is
(Equation 3)
And the age-specific pregnancy-related mortality ratio is
(Equation 4)
Step 3: Estimate population-level measures
Estimates of the pregnancy-related mortality rate, and the proportion of deaths that are pregnancy-related in the population of women of reproductive age (taken here as those aged 15-49) are derived by weighting the age-specific rates derived above by the number of women aged 15-49 in the households surveyed. Thus
(Equation 5)
and
(Equation 6)
and
(Equation 7)
Worked example
The application of the method is illustrated using data collected in the 2004 Malawi DHS. Women were asked about the survival, and - if dead - timing of death relative to pregnancy, of sisters.
Step 1: Extract tabulations of the data
Tabulations of the required input data are presented in Table 1. The tabulations of reports of sisters’ deaths and exposure are for the seven years before the survey.
Table 1 Input data used to estimate pregnancy-related mortality, Malawi 2004 DHS
Age group | Sister deaths | Sister exposure | Pregnancy-related deaths | Age-specific fertility | Household female population |
|---|---|---|---|---|---|
(i) | (ii) | (iii) | (iv) | (v) | |
15-19 | 117 | 27,622 | 8 | 0.162 | 2,570 |
20-24 | 227 | 29,331 | 52 | 0.293 | 3,036 |
25-29 | 299 | 23,763 | 64 | 0.254 | 2,247 |
30-34 | 245 | 17,228 | 50 | 0.222 | 1,516 |
35-39 | 230 | 12,206 | 33 | 0.163 | 1,122 |
40-44 | 177 | 7,892 | 22 | 0.080 | 970 |
45-49 | 82 | 4,574 | 12 | 0.035 | 743 |
Total | 1376 | 122,616 | 240 | 0.204* | 12,204 |
| * General Fertility Rate calculated as age-specific fertility rates weighted by age distribution of the female household population | |||||
Source: Malawi DHS 2004 Tables 13.2 (p.245) and 13.3 (p.247) | |||||
Step 2: Derive measures of mortality
Application of the method is shown in Table 2, using the data presented in Table 1. The first column of Table 2 shows age-specific mortality rates, calculated by dividing female deaths by age (col. i of Table 1) by sisters’ exposure in years (col. ii of Table 1) as described by Equation 1. The second column shows age-specific pregnancy-related mortality rates, calculated as for the all-cause age-specific rates but using pregnancy-related deaths only (col. iii of Table 1) in the numerator (Equation 2). Column 3 shows the age-specific proportions of female deaths that were reported to be pregnancy-related (col. iii of Table 1 divided by col. i of Table 1 - Equation 3). Column 4 shows age-specific pregnancy-related mortality ratios, calculated by dividing pregnancy-related deaths (col. iii of Table 1) by the product of sisters' exposure in years and the age-specific fertility rates (col. ii and col. iv) and multiplying by 100,000 (Equation 4).
Table 2 Adult female mortality rates and pregnancy-related mortality rates, Malawi, 2004 DHS
Age Group | Age-Specific Mortality Rate | Age-Specific Pregnancy-Related Mortality Rate | Proportion of Deaths Pregnancy-Related | Age-Specific Pregnancy-Related Mortality Ratio |
|---|---|---|---|---|
= 1000*(i)/(ii) | = 1000*(iii)/(ii) | = (iii)/(i) | = 100000* iii /(ii*iv) | |
15-19 | 4.24 | 0.29 | 0.0684 | 178.8 |
20-24 | 7.74 | 1.77 | 0.2291 | 605.1 |
25-29 | 12.58 | 2.69 | 0.2140 | 1060.3 |
30-34 | 14.22 | 2.90 | 0.2041 | 1307.3 |
35-39 | 18.84 | 2.70 | 0.1435 | 1658.6 |
40-44 | 22.43 | 2.79 | 0.1243 | 3484.5 |
45-49 | 17.93 | 2.62 | 0.1463 | 7495.8 |
Total* | 11.51 | 1.99 | 0.1681 | 970.7 |
* Note: all the totals in this table are standardized onto the age distribution of the female household population (see text). | ||||
It is important to note that the entries in the Total row in Table 2 are not calculated by summing events and exposure across age groups. The reason for this is that the age pattern of sister exposure is not the same as the age pattern of the female population of reproductive age. To obtain valid population-level estimates of totals, it is necessary to re-weight the age-specific rates and ratios in Table 2 by the proportional female age distribution in col. v of Table 1, as described by Equations 5, 6 and 7. The denominator in Equation 7 is also not the General Fertility Rate as normally calculated (births divided by female population aged 15 to 49) but rather the age-distribution weighted sum of age-specific fertility rates.
Step 3: Estimate population-level measures
Table 3 compares the proportion of births in each 5-year age group (calculated as the product of the household female population and the age-specific fertility) to the proportion of PRD (calculated as the product of the household female population and the age-specific PRMRate) in each age group.
Table 3 Comparison of proportions of births and pregnancy-related deaths by age group: Malawi DHS 2004
Age | Female household population | Age-specific fertility | Pregnancy-related deaths | Births | Proportion of : | |
|---|---|---|---|---|---|---|
Pregnancy-related deaths | Births | |||||
15-19 | 2,570 | 162 | 8 | 416 | 0.033 | 0.167 |
20-24 | 3,036 | 293 | 52 | 890 | 0.217 | 0.356 |
25-29 | 2,247 | 254 | 64 | 571 | 0.267 | 0.228 |
30-34 | 1,516 | 222 | 50 | 337 | 0.208 | 0.135 |
35-39 | 1,122 | 163 | 33 | 183 | 0.138 | 0.073 |
40-44 | 970 | 80 | 22 | 78 | 0.092 | 0.031 |
45-49 | 743 | 35 | 12 | 26 | 0.050 | 0.010 |
Total | 12,204 | 240 | 2,500 | 1.000 | 1.000 | |
Diagnostics, analysis and interpretation
Checks and validation
For checking and validating overall estimates of female mortality, see the section of the manual on the analysis of sibling histories. Checking and validating the extra information provided about pregnancy-related mortality depends on plausibility checks. Is the overall proportion of deaths of sisters of reproductive age reported as pregnancy-related plausible, given the estimated pregnancy-related mortality ratio? Is the distribution of pregnancy-related deaths by age plausible given the age pattern of births (the risky events)?
No generally accepted way exists to assess the plausibility of the overall proportion of deaths pregnancy-related. In general, there is a positive association between the proportion of deaths pregnancy-related and the PRMR, but the association hinges on the level of non-pregnancy-related mortality and provides no useful basis for evaluation. The plausibility of the age distribution of pregnancy-related deaths is assessed in comparison to the distribution of births by age, as shown in Table 3. In the case of the 2004 Malawi DHS, the proportions of pregnancy-related deaths contributed by the age groups 15-19 and 20-24 are much lower than the corresponding proportions of births, and the reverse is true over the age of 35. The latter can be plausibly explained by the increasing riskiness of pregnancy and childbirth for women over age 35, but no plausible explanation exists for the large differences under age 25. The suspicion is strong that deaths of sisters under the age of 25 that were actually pregnancy-related have not been reported as such.
Interpretation
Interpretation of estimates of pregnancy-related mortality from sibling histories needs to pay close attention to sampling uncertainty and typical data errors. Sampling uncertainty is very large by comparison with DHS estimates of under-5 mortality. Figure 1 plots coefficients of variation (standard error divided by the estimate) for DHS estimates of PRMRs by number of siblings reported on. The coefficients of variation are above 0.08 even for very large samples, and above 0.10 for all but a handful of surveys.
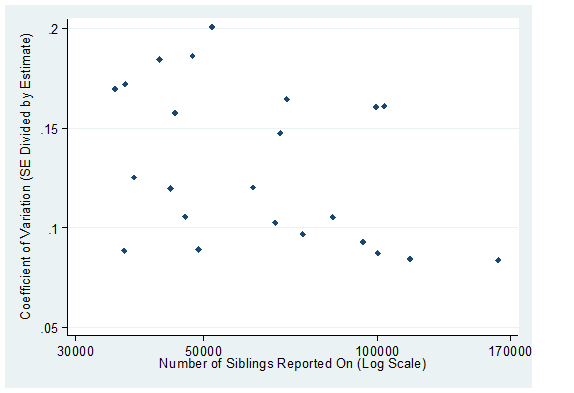
Sources: Stanton, Abderrahim and Hill (2000) for estimates prior to the year 2000, and DHS country reports for years 2004 and later
Given the large sampling uncertainty, interpretation of sub-national differences or other sub-group differences such as by age is hazardous. Typical data errors, particularly the omission of deaths for time periods more distant from the survey, make any interpretation of trends within data sources questionable. Any conclusions about trends should be based on estimates from two or more surveys for comparable time periods before each survey and taking into account sampling uncertainty.
References
Gakidou E and G King. 2006. "Death by survey: estimating adult mortality without selection bias from sibling survival data", Demography 43(3):569-585. doi: https://dx.doi.org/10.1353/dem.2006.0024
Masquelier B. 2013. “Adult mortality from sibling survival data: A reappraisal of selection biases?”, Demography 50(1):207–228. doi: https://dx.doi.org/10.1007/s13524-012-0149-1
Obermeyer Z, JK Rajaratnam, CH Park, E Gakidou et al. 2010. "Measuring adult mortality using sibling survival: a new analytical method and new results for 44 countries, 1974-2006", PLoS Medicine 7(4):e1000260. doi: https://dx.doi.org/10.1371/journal.pmed.1000260
Stanton C, N Abderrahim and K Hill. 2000. "An assessment of DHS maternal mortality indicators", Studies in Family Planning 31(2):111-123. doi: https://dx.doi.org/10.1111/j.1728-4465.2000.00111.x
Trussell J and G Rodriguez. 1990. "A note on the sisterhood estimator of maternal mortality", Studies in Family Planning 21(6):344-346. doi: https://dx.doi.org/10.2307/1966923
- Printer-friendly version
- Log in to post comments