Childhood mortality estimated from health facility data: the Preceding Birth Technique
Background
In the introduction to child mortality section, we have already drawn attention to the possibility of using data collected at health facilities to measure early childhood mortality. Setting selection issues aside for the moment, the most useful technique for obtaining such mortality measures is based on a simple question put to a mother when expecting or delivering her next child, here referred to as the index child. At the time of the pregnancy or delivery, the supplementary information needed is whether or not the previous live birth is alive or dead at the time of the subsequent pregnancy or birth of the index child. For a set of mothers (generally not less than 1,000 respondents), the proportions dead amongst the previous live-born children are then converted into a measure of early childhood mortality. This measure is usually close to 2q0, but can be closer to 3q0 when birth intervals are long. Variations of the method also allow the proportions of preceding children dead obtained before the delivery of the index child, for example at the time of an antenatal visit, or after the delivery of the index child, to be converted into measures of early childhood survival.
There are several attractive features of child survival information gathered in this way from hospitals, clinics and other health centres. First, the information often forms part of the routine health system reporting so the need for special studies and surveys is obviated. Second, when such information comes from health facilities, additional information which is difficult to obtain in retrospective surveys can be obtained relatively easily. This includes characteristics of the mother as well as key attributes of the births including sex and birth order, and birth weight. Third, the data can be disaggregated to provide detailed estimates for particular health facilities (when the population in the clinic’s catchment area is sufficiently large), for towns and small provinces. Such local or facility-based information could be useful to health authorities intent on targeting the communities with the worst infant and child mortality rates. Trends at the local level can also be used to assess the effectiveness of past health interventions. Finally, we can expect the data in health facilities to be reasonably accurate as they are mostly being collected by literate professionals. Further, clinic-based respondents may be more prepared than mothers to report events which are otherwise seen as stigmatizing (distinguishing live births, still births, abortions and miscarriages) or painful to recall (a neonatal or infant death).
Origin of the Preceding Birth Technique methods
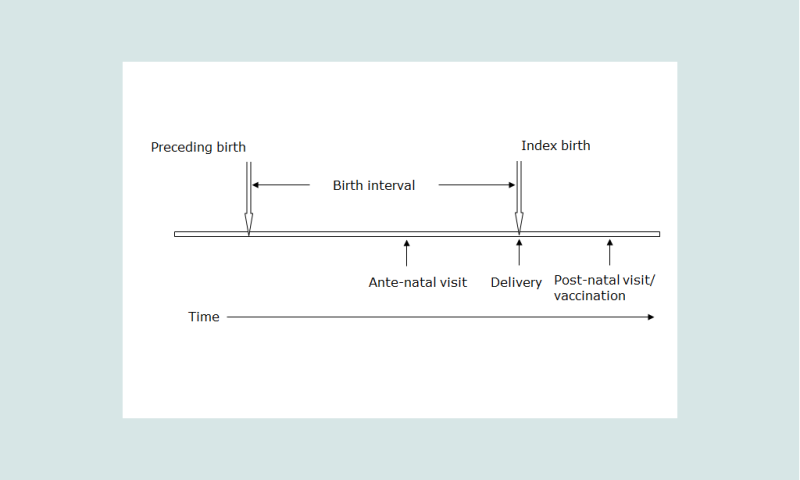
The technique has its origins in a study of mortality in the Solomon Islands in the 1980s. In the course of this study it was noted that amongst the information routinely collected in maternity centres were answers to the questions on children ever-borne and surviving as well as a question on the survival of the preceding born child if the mother was delivering her second or subsequent child, the index birth (see Figure 1). Brass and Macrae set out to ascertain how these data could be related to conventional measures of child survival estimated from summary birth histories and the proportions dead of preceding births (Brass and Macrae 1984, 1985). Two methods were proposed. The Preceding Birth Technique (PBT) has attracted most attention since it provides a running estimate of early childhood mortality close to the current period. The theoretical basis of the method has been expanded and developed to allow applications to data on the survival of preceding children collected before and after a birth (Aguirre 1994; Aguirre and Hill 1988; Hill and Aguirre 1990). The second method (Brass and Macrae 1985), based on the total numbers of children ever-borne and surviving requires more refinement, is more complicated to apply and is not discussed further here.
Subsequently, others have applied the PBT in a variety of circumstances for different purposes – for example, in refugee camps, to measure abortion rates in antenatal clinics, for small area estimation and to measure the impact of health interventions (Bicego, Augustin, Musgrave et al. 1989; Madi 2000; Oliveras, Ahiadeke, Adanu et al. 2008; Rowe, Onikpo, Lama et al. 2011). Research in a demographic surveillance site where births and deaths had been accurately and independently recorded showed that good results could be obtained when contraception had become widespread and birth intervals had lengthened as well as when the data had been collected at antenatal rather than maternity clinics or at the time of the first vaccination of the new born (Bairagi, Shuaib and Hill 1997).
Caveats and warnings
The analyst faces several difficulties in making use of facility-based data on child mortality. The most important of these is that the population attending the facilities is not randomly selected. The resulting selection biases are important in three main ways.
The first bias in facility-based data arises because of the incomplete coverage of the population by health facilities, both public and private. This selection can work in different ways. Often, the urban population has easier access to health facilities than the rural population. The better off and better educated often make greater use of modern health services than the poor and the illiterate. This bias would likely result in estimates that are too optimistic in respect of infant and child mortality. In some cases, however, the bias can work in the other direction. The tertiary referral centres, which are generally the central maternity or teaching hospitals, often have much worse outcomes than peripheral centres simply because most complicated cases requiring surgery and other forms of advanced care are referred to these centres. Estimates based on such facilities will therefore tend to be over-estimate infant and child mortality.
The extent of this first bias is reduced when the coverage rates of health facilities used as a source of data are high. Even in sub-Saharan Africa, using the most recent DHS surveys for 38 countries, we find that 51 per cent of mothers delivered in a health facility, 76.5 per cent of mothers in urban areas. For antenatal visits, an even higher proportion, 93 per cent, were seen by a doctor or a health professional in urban areas in sub-Saharan Africa with a surprising 76 per cent being seen for antenatal care by a doctor or health professional even in rural areas ((STATcompiler)). With these high coverage figures, it is possible to address some of the biases associated with incomplete coverage of the population. We therefore present below a method to estimate early child mortality from the proportions of preceding born children dead when mothers attend antenatal clinics or even vaccination clinics. These options are discussed below in the section entitled "Extensions".
When coverage of the population by the health facilities is much lower, selection bias is clearly more important. Survey or census data for the whole population may be used to adjust the figures coming from health facilities by comparison of the characteristics of users and non-users of the health services. An added complication is that many countries are trying hard to extend the coverage of their health services. This may add new sub-populations with distinctive mortality patterns to the pool of information on child survival. Such changes in coverage can make the interpretation of trends over time difficult. In most large populations, however, new facilities take time to add and thus the coverage of existing facilities changes quite slowly.
The second source of systematic bias is that virtually all the women seen in maternity hospitals and health centres are attending these facilities because they are about to have a baby. Any information gathered from these women is specific to these moments in their reproductive careers. By contrast, in random sample surveys, women are interviewed without any reference to the current stage of their reproductive life and so the information obtained from them is representative of the reports from all, or all parous, women. An adjustment has been proposed to make the facility-based reports on total children ever-born and dead more like the reports in household surveys. The adjustment, however, now seems too dependent on various assumptions such as the effect of birth order on child survival and the location in time of child deaths (Brass and Macrae 1985).
A third selection bias that arises with this method is the fact that each woman’s last birth is never reported because there is no subsequent ‘index’ birth. This bias is probably trivial in high fertility settings, but in a population in which many women have only two children, there will be an over-representation of first births, which typically have above average mortality. In a population in which a substantial proportion of women have only one birth, the preceding birth technique will also not provide unbiased estimates of early childhood mortality.
Detailed description of method
A diagram helps to understand the terms used in this explanation. Figure 1 shows an idealized birth interval Ī for a woman with the three possible points of contact with the health services – for an antenatal visit, at the time of the delivery and after the delivery for a post-partum check-up or vaccination of the new born infant.
Models and empirical data have shown that the proportions dead amongst preceding birth children, Q, collected close to the time of the delivery of the index birth are close to the probability of dying by an age which is close to 80 per cent of the mean live birth interval, Ī. Tabulation of the median birth intervals for 35 of the most recent surveys covering the period 1990-2010 in sub-Saharan African countries shows that the median birth interval was 34.8 months (STATcompiler). The only countries with median birth intervals over 40 months were Ghana (40), Namibia (42), South Africa (47) and Zimbabwe (47). The proportions of preceding births dead at the time of delivery of the index child is thus close to the proportions dead by the second birthday, in life table notation, 2q0.
The reason that the proportion of previously born children who have died by the time of a subsequent birth closely approximates 2q0 in a life table is because the proportion dead is the integrated product of two asymmetrical functions. One is the distribution of births over time before the most recent birth, b(x), and the other is the cumulative probability of dying, q(x), taken from the early part of a life table. The monthly distribution of previous births is skewed with no live births occurring during the nine months preceding the current maternity but with a concentration of births around the mean birth interval, say 30 months, and a long tail stretching back in time before the most recent birth. The cumulative probabilities of dying in childhood in any life table rise quickly during the first two years of life but thereafter, the cumulative proportions dead, qx, flatten out beyond the age of two years ((Hill and Aguirre 1990).
Figure 2 illustrates the shape of these two functions using real birth interval data (hence the slight irregularities attributable to date misreporting) and the probabilities of dying by month since birth taken from the UN General Model life table with a life expectancy at birth of 60 years.
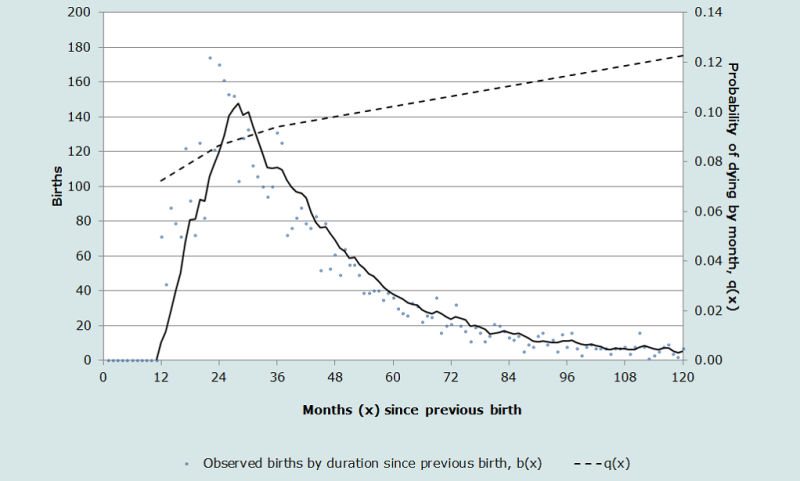
We see that the proportion of previously born children who have died, Q, is thus the integrated product of these two functions.
Mathematically:
(Equation 1)
where b(x) is the number of births which occurred x months before the current maternity, and q(x) is the cumulative probability of dying by age x. In short, as may be shown from models and from empirical work using birth histories to simulate data on child survival collected at the time of a subsequent birth, the proportions of previous children who have died at the time before a subsequent maternity may be taken as a good estimate of xq0 where x is generally equivalent to 0.8 of the mean birth interval Ī. When the birth intervals are close to 30 months, the proportions of preceding children dead will be approximately 2q0. Since the method is primarily designed to measure year to year changes in child survival by facility, the main interest will be in the value of the index rather than in its exact representation in the life table. However, the main confounding effect in comparing results across different populations or over time, will be due to differences in birth interval length. As Rutstein’s analysis has shown, median birth intervals have changed very slowly between the first and last DHS surveys in each country and especially in sub-Saharan Africa, so temporal effect changes in birth interval length are probably of minor importance (see Rutstein (2011: Table 2.2a)). The convention is that the proportions of preceding children dead collected at the time of a subsequent birth are simply referred to as the “index of early childhood mortality”, and taken as a close approximation to 2q0 in most populations and to 2.7q0 in populations with birth intervals closer to 40 months (in Africa, mostly the countries of southern Africa with Ghana). Clearly, many low fertility countries have longer birth intervals but most such countries have good vital registration systems and so will not be the main users of the PBT.
We can estimate the possible effects of birth intervals differing from 30 months on the child mortality measures by using model life tables. We use the UN General Standard model for both sexes combined with a life expectancy at birth of 60 years to calculate the monthly probabilities of dying up to age 5. Then, we calculate the percentage differences in the measure of early childhood mortality when the birth interval differs from 30 months and the exposure time is not 0.8 * I or 24 months (2q0). When the birth interval is 25 months and hence the exposure time is 25 * 0.8 = 20 months, as might occur if the data are collected at ante-natal visits, then the proportions of preceding children dead is closer to 1.7q0 or 5 per cent lower than if the birth interval had been 30 months. With birth intervals as long as 40 months, then the proportions of preceding birth children dead approximates to 2.7q0, a 7 per cent difference from the central value of 2q0 associated with a birth interval of 30 months. If the interval between the birth of the preceding birth and the time the data are collected is as long as 45 months, as might occur if the mothers are seen some time after the birth of the index child, then the child mortality measure estimated is approximately 3q0 or 9per cent more than 2q0 in the model life table. Although important, these differences are not large and the percentages are likely to remain the same in the short term.
Model life tables can be used to interpolate between the various measures of child mortality derived from the PBT. With birth intervals of 30 months, we are estimating approximately 2q0 but by using logit transformations of model life tables, we can readily derive corresponding values of 1q0 (infant mortality) and 5q0 (the U5MR used by UNICEF). An example of the interpolation method is shown in Table 2. The same procedures can be used to derive 2q0 when the intervals between the preceding birth and the index birth are not 30 months, if the birth interval is curtailed by collection of the data at ante-natal visits or if the time since the birth of the preceding birth is extended by collection of the data say, at first vaccination of the index child. The associated worksheet shows how to do this in detail.
Numerous questions arise from the simple result that Q≈ (Ī .0.8) q0. First is the issue of the omission of women with only one birth and thus no preceding birth. In most populations lacking full vital registration, however, most women proceed to have at least a second child so the mortality experience of first births is not omitted from the data and consequently this bias is small. There may still be a concern in low fertility populations, however, that first births are over-represented in the data. Second, women who die in childbirth may not survive long enough to report on the survival of their previous children, although clinical records are often available ahead of the death. We know that the risks of losing subsequent children are strongly associated with a maternal death, as the Bamako data bear out (Hill and Aguirre 1990) but fortunately maternal deaths are sufficiently rare as to have a small effect on the data collected this way.
The time reference of the PBT estimates is important to establish and again Figure 2 helps us to estimate the mean time at death of preceding children who died before the index birth. The combination of relatively high risks of dying early in life (see the q(x) function) combined with the concentration of births around the mean birth interval points to a mean age at death substantially less than half the birth interval. From models, Aguirre (1990) showed that the mean time location of deaths to the preceding born children was about two-thirds of the birth interval length before the date of birth of the index children. From empirical data with a wide range of birth intervals, the range was between 54 per cent and 74 per cent of the birth interval in months before the dates of birth of the index children. In most applications, it is recommended that analysts take the time reference to be two-thirds of the preceding birth interval before the birth of the index children. This assumption has been built into the accompanying estimation spreadsheets.
Data requirements
The key sequence of essential questions is simple, assuming the woman being interviewed in the health facility is pregnant (antenatal visit), newly delivered (in a maternity clinic or hospital) or has brought a young infant for immunization:
- ‘Were you pregnant another time before this current pregnancy/birth?’
If ‘yes’, continue. If ‘no’, stop.
- ‘What was the result of this previous pregnancy?’ (live birth, still birth, miscarriage or abortion – spontaneous or induced).
If ‘live birth’ continue, If other, stop.
- ‘Is this previous born child still alive today?’ (yes/no)
Date of interview (usually date of the delivery of the index child) is also needed but this generally forms part of the administrative records.
These are the basic questions. Others related to the care of the mother and her children are often added, such as the date of birth of the preceding child, its sex, its birth weight (if known), whether a singleton or multiple birth, whether still being fully breastfed and so on, depending on needs and circumstances. Similarly, some additional information on the mother (age, education residence) as well as information on the current delivery such as birth weight and place and type of delivery (normal vaginal, forceps, vacuum, caesarean etc.) can be relevant for maternal and child health care (if the mother is seen post-partum). Collecting the date of the birth of the child preceding the current delivery provides useful information on the average birth intervals in the population under study.
Often, the data are obtained in clinics in the form of registers or ledgers. An example of one is shown in Table 1 below. The content of each of the columns can be varied for different purposes but the key questions for the estimation of early child mortality are clearly the questions in columns (7) and (8). Note that in health systems gravidity (total number of pregnancies, however short their duration) often replaces the total number of live births but with training, health workers can readily distinguish the more medical definitions (gravidity, parity, confinements) from the more demographic terms (pregnancies, live births and living children).
Table 1 Example of data collection register for implementation of the preceding birth technique
Date of delivery (1) | Mother’s name or ID (2) | Mother’s age or date of birth (3) | Gravidity (total pregnancies) (4) | Live births (5) | Living children (6) | This delivery: type (live birth, still birth, abortion or miscarriage) (7) | Singleton or multiple birth? (8) | If live birth preceding birth alive today? (9) | Sex of last delivery: male/ female (10) |
|---|---|---|---|---|---|---|---|---|---|
| 27 Jan 2012 | Mariama Sow | 31 Oct 1980 | 7 | 5 | 4 | Live birth | Single | Yes | M |
| 28 Jan 2012 | Comfort Frempong | 27 June 1991 | 3 | 3 | 2 | Still born | N.A. | N.A. | N.A. |
| 29 Jan 2012 | Huda Khalaf | 19 Oct 1992 | 3 | 2 | 2 | Live birth | Twin | 1 – Yes
| M |
| 29 Jan 2012 | Huda Khalaf | 19 Oct 1992 | 3 | 2 | 2 | Live birth | Twin | 2 - No | F
|
| 30 Jan 2012 | Mary Kenyatta | 22 yrs | 3 | 2 | 1 | Miscarriage | N.A. | N.A. | N.A. |
Note: In this example, words have been used instead of codes but in most applications, the optional answers would be pre-coded to standardize responses and to minimize the work by the health staff. The summary counts of pregnancies, live births and living children exclude the most recent pregnancy or birth. Twins or triplets need to be separately recorded – see table.
Worked example
The basic form of the analysis is very simple – at the time of birth of the index child, divide the number of preceding children dead (Row B in Table 2) by the total number of preceding live born children. Still births are excluded from the calculations.
Table 2. Preceding birth technique estimates of early childhood mortality for Bamako, Mali in 1985.
Measures | Preceding births | Second-to-last births |
|---|---|---|
(1) | (2) | (3) |
| Total alive amongst preceding live births (A) | 4778 | 3737 |
| Total dead amongst preceding live births(B) | 679 | 620 |
| Proportions of preceding born children dead (B/A) | 0.142 | 0.166 |
Source: Data from the Bamako maternity clinics study (Hill and Aguirre 1990).
In cases where there is an interest in estimating other life table measures, infant and under 5 mortality can be estimated using a standard from model life tables and logit transformations. In Table 3, we illustrate the steps involved in using logit transformations of model life tables values to produce values of 1q0 and 5q0. These methods are included in the associated spreadsheets.
In some circumstances, information on the survival of the second-to-last born children, the child born before the preceding birth (if any). In crude terms, the period of exposure to the risks of dying for this second-to-last born child will be slightly shorter than twice the mean birth interval, Ī. Taking Ī = 30 months, the proportions of second- to-last children dead at the time of the current maternity will thus be approximately 2.Īq0, i.e. 5q0. The reported proportion of second-to-last children who have died is close to the probability of dying during the first five years of life and not some younger age in this case, as the monthly birth distribution and the cumulative probabilities of dying are much flatter around the age of five than around the age of two years. In applications, the difficulty is that these data on the second-last child have been obtained from mothers who have had at least three deliveries or at least two deliveries and a third pregnancy. Thus, the systematic selection of women with higher parities and probably with higher fecundity (shorter birth intervals) exacerbates these biases relative to the case of the simple preceding birth version of the method (Hill and Aguirre 1990). Although included in the illustration below, the use of information on the survival of second-to-last born children to estimate recent child mortality is not recommended.
Table 3. Using logits and the UN General Standard model life table to estimate values of infant and under-5 mortality from the proportions of preceding and second-to-last births dead at the time of a subsequent delivery
Measure | Observed proportions dead | Proportions alive | l(2) in UN General model life table: e(0)=60 | logit l(2) | Logit l(2) observed | Alpha | 1q0: estimated infant mortality | 5q0: estimated under 5 mortality |
|---|---|---|---|---|---|---|---|---|
| Proportion of preceding births dead | 0.142 | 0.858 | 0.914 | -1.179 | -0.899 | 0.280 | 0.120 | 0.166 |
| Proportions of second-to-last births dead | 0.166 | 0.834 | 0.914 | -1.179 | -0.807 | 0.372 | 0.141 | 0.193 |
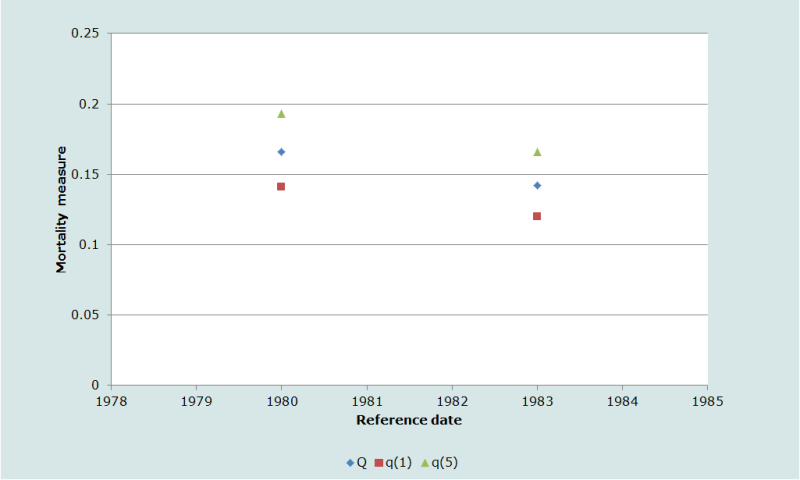
In Figure 3, we show the relationship of the different mortality measures estimated in Table 3. The data at face value suggest that child survival was improving in the period before the data were collected in Bamako’s maternity clinics. We must remember, however, the selection effects implicit in using the data from second-to-last births since only women with three or more births provide the information used to estimate the measures in the last row of Table 3.
Extensions
A common criticism of the PBT method is that the rates are necessarily calculated for the population attending the health centres and maternity clinics and tell us nothing about the child mortality rates amongst mothers not attending such centres. As noted above, in most countries more and more mothers are giving birth in health centres of one kind or another so that gradually, the PBT estimates of child mortality will become more representative. In the interim, it is often worth exploring collection of the essential information elsewhere.
The most obvious opportunity to contact a larger proportion of mothers arises at the moment of first antenatal booking. As noted above, the proportion of pregnant women who attend such clinics is now quite high even in places with very low levels of vital registration (and delivery in health facilities). Very few adjustments are needed to adapt the collection of the essential information for the PBT in antenatal clinics. The main risk is that the information is collected multiple times from the same mother. Care must therefore be taken to ensure that the preceding birth technique information is obtained at first booking and not at all subsequent visits.
The main technical issue to be resolved is that compared with the time of delivery, the preceding birth interval will be curtailed when the information is obtained during an antenatal visit. This means that the proportion dead amongst preceding births will probably be a slight underestimate of the true value of 2q0 in the population. In many instances, however, pregnant women do not present for the first antenatal visit until the pregnancy is well advanced. In these cases, the curtailment in the length of the birth interval will be a matter of a few months. The slight reduction in exposure has only a very small effect on the measure of early childhood mortality (Bairagi, Shuaib and Hill 1997; Hill and Aguirre 1990).
Another alternative for obtaining the key information to apply the Preceding Birth Technique method is to include the questions at the time of the first vaccination of the baby since coverage rates for vaccination are often quite high both for mothers giving birth in clinics and for mothers who give birth at home. Again the basic format of the questions remains the same. Careful wording and training is needed to distinguish the new-born child being vaccinated from the preceding birth whose survival has to be established to use the preceding birth technique. Since the vaccination protocol begins – or should begin – in the first month of the new-born baby’s life, the extension of the exposure time of the preceding child to the risks of dying compared to the time of delivery is very short. The proportions of preceding born children dead at the time of vaccination can therefore be taken as a good approximation of 2q0. There may be problems in preventing multiple reporting from mothers who return for several rounds of vaccination but this can be managed (Hill and Kelly 1996). More important is the effect of mortality of the new-born child since mothers who lose a child soon after birth will not appear in vaccination clinics. If mortality of successive children is not independent, this would lead to an overall under-estimate of the index of early child mortality.
Trends over time and comparisons between areas
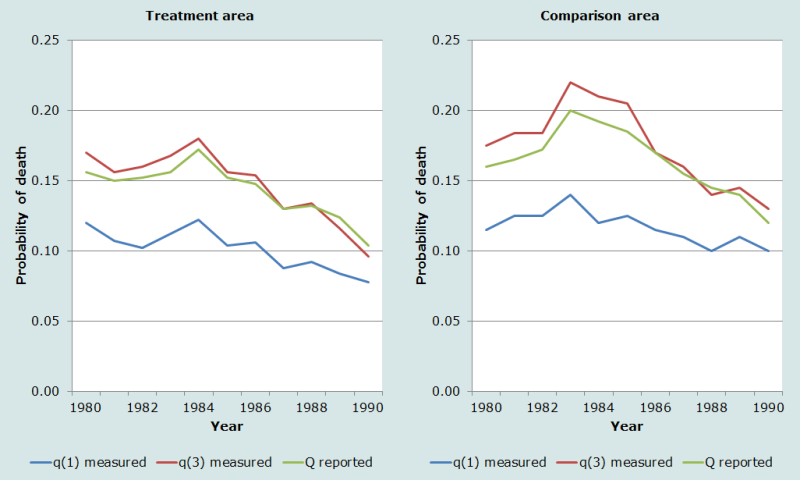
The most appropriate application of the preceding birth technique is for the study of early childhood mortality trends in sub-populations followed over time or for the comparison of child mortality trends different sub-populations. There are several countries now ranging from Senegal and Mali to the Sultanate of Oman where ongoing estimates of early childhood mortality are derived from information collected at maternity clinics. The application below, however, is derived from the Matlab Thana surveillance site in Bangladesh where we have the added advantage of well-recorded vital registration data in parallel with the information on the survival of the previously born child collected at the time of the birth. In the Matlab Thana study area, it is possible to compare in addition the childhood mortality in the ‘Treatment’ and ‘Comparison’ areas, providing additional support for the validity of the information from the method.
In Figure 4 below, the middle lines in both the Treatment and the Comparison areas illustrate the trend in early childhood mortality derived from the questions on the survival of the preceding birth collected at the time of the birth of the index child. The lowest lines show the time trend in infant mortality derived from the vital registration system and the upper line is 3q0, also calculated from the vital registration data. The measure of early childhood mortality matches very closely the trend in 3q0 since in this population with birth intervals close to 40 months, the Preceding Birth Technique is measuring mortality to about age 2.7 years or 2.7q0. The goodness of fit between the directly measured child mortality measures and the proportions of preceding children dead is encouraging.
Comparison of mortality trends in sub-populations
This illustration stems from the study of early childhood mortality in the maternity clinics of Bamako, Mali where the additional information on the birth weight of the last born child (the infant delivered in the maternity clinic) was also recorded. As Table 4 illustrates, there is a very strong relationship between the birth weight of the index child, the most recent birth, and the survival of the preceding born children. This analysis clearly illustrates the concentration of excess risks in certain mothers and makes the case for targeting such high risk women in order to reduce early childhood mortality. In the same study, there were enough births occurring in each maternity over the course of a year to be able to calculate the index of early childhood mortality for each facility. This led to a rank ordering facilities according to the proportions of preceding children dead at the time of subsequent delivery and led to the identification of underperforming facilities and populations in their catchment areas which were in need of extra resources.
Table 4 Proportions of last and second-to-last births dead by the time of a subsequent birth, by the birth weight of the most recent born child.
Birth weight of the Index child (grams) | Preceding births | |
|---|---|---|
N | Proportions dead ≈ 2q0 | |
1500-1999 | 76 | 0.197 |
2000-2499 | 409 | 0.161 |
2500-2999 | 1389 | 0.153 |
3000-3499 | 1827 | 0.136 |
3500-3999 | 607 | 0.104 |
4000 or more | 98 | 0.092 |
Source: Bamako maternity clinics study (Hill and Aguirre 1990).
References
Aguirre A. 1990. "The Preceding Birth Technique for the Estimation of Childhood Mortality: Theory, Extensions and Applications." Unpublished PhD thesis, London: University of London.
Aguirre A. 1994. "Extension of the preceding birth technique", Genus 50(3-4):151-169.
Aguirre A and AG Hill. 1988. "Estimacion de la mortalidad de la ninez mediante la tecnica del hijo previo con datos provenientes de centros de salud o de encuestas de hogares: aspectos metodologicos. [Estimating child mortality using the previous child technique, with data from health centers and household surveys: methodological aspects]", Notas Poblacion 16(46-47):9-39.
Bairagi R, M Shuaib and AG Hill. 1997. "Estimating childhood mortality trends from routine data: a simulation using the preceding birth technique in Bangladesh", Demography 34(3):411-420. doi: https://dx.doi.org/10.2307/3038293
Bicego G, A Augustin, S Musgrave, J Allman and P Kelly. 1989. "Evaluation of a simplified method for estimation of early childhood mortality in small populations", International Journal of Epidemiology 18(4 Suppl 2):S20-32. doi: https://dx.doi.org/10.1093/ije/18.Supplement_2.S20
Brass W and S Macrae. 1984. "Childhood mortality estimated from reports on previous births given by mothers at the time of a maternity: I. Preceding-births technique", Asian and Pacific Census Forum 11(2):5-8. https://hdl.handle.net/10125/3561.
Brass W and S Macrae. 1985. "Childhood mortality estimated from reports on previous births given by mothers at the time of a maternity: II. Adapted multiplying factor technique", Asian and Pacific Census Forum 11(4):5-9. https://hdl.handle.net/10125/3562.
Hill AG and A Aguirre. 1990. "Childhood mortality estimates using the preceding birth technique - some applications and extensions", Population Studies 44(2):317-340. https://dx.doi.org/10.1080/0032472031000144616
Hill AG and PG Kelly. 1996. Sur la mise en place de la technique de l'accouchement precedent, Senegal, 19 au 26 Janvier 1996 [On the implementation of the Preceding Birth Technique, Senegal 19-26 January 1996]. Arlington,VA: Partnership for Child Health Care.
Madi HH. 2000. "Infant and child mortality rates among Palestinian refugee populations", Lancet 356(9226):312. doi: https://dx.doi.org/10.1016/S0140-6736(00)02511-3
Oliveras E, C Ahiadeke, RM Adanu and AG Hill. 2008. "Clinic-based surveillance of adverse pregnancy outcomes to identify induced abortions in Accra, Ghana", Studies in Family Planning 39(2):133-140. doi: https://dx.doi.org/10.1111/j.1728-4465.2008.00160.x
Rowe AK, F Onikpo, M Lama, DM Osterholt and MS Deming. 2011. "Impact of a malaria-control project in Benin that included the integrated management of childhood illness strategy", American Journal of Public Health 101(12):2333-2341. doi: https://dx.doi.org/10.2105/AJPH.2010.300068
Rutstein S. 2011. Trends in Birth Spacing. DHS Comparative Reports No. 28. Calverton, MD: ICF Macro. https://www.dhsprogram.com/pubs/pdf/CR28/CR28.pdf
The DHS Program. STATcompiler. https://www.statcompiler.com/en/.
- Printer-friendly version
- Log in to post comments