Assessment of parity data
Introduction
The first type of question on fertility asked in censuses concerns women’s lifetime fertility. It asks about their total number of live births. In order to reduce underreporting of dead or absent children (who are usually a larger proportion of children born to older women than younger women) and guard against underreporting of girls, the questions are often structured as a series of six questions about the number of sons and daughters:
- born alive and living with the mother;
- born alive but living elsewhere; and
- born alive but now deceased.
Total children born and surviving
The total of the answers to the questions relating to living children, present and absent, provides the total number of children born and surviving. Adding the reported numbers of children dead gives the total number of children ever born to the woman. When summing these individual answers, care must be taken not to treat error or missing value codes as legitimate responses. For example, if a missing value is coded as ‘9’, the procedure for deriving measures of the total children ever born, surviving and dead must make sure to exclude these codes.
Tabulations of the numbers of children reported in response to these questions are often truncated at some relatively high number (e.g. 9+). When this is the case, the only plausible assumption is that women in that category have had the number of children defined by the lower bound of the interval. The resulting errors are generally small, even in the case of extremely high fertility, unless the truncation is applied to the total children ever born, rather than to the separate categories of co-resident, absent, and dead sons and daughters.
Implausible parities
In evaluating the quality of data on lifetime fertility, the analyst should be alert to improbable and implausible parities relative to the age of the mother. Especially at young ages, a small number of women reporting excessively high numbers of children ever born can have a material effect on the estimated mean children ever born. Such errors can result from misreporting, or manual or automatic mis-capturing of the data. A useful rule of thumb is to limit the maximum number of live births that a women may have had to one birth every 18 months from the age of 12, rounding down to the next integer. Using this rubric, by exact age 20 (the end point of the 15-19 age group), a woman might have had a maximum of 5 children; by exact age 25 (closing the 20-24 age group), 8. If the reported number of lifetime births exceeds this maximum, the recorded value should be recoded as ‘missing’.
Assessment of enumerator errors
Another common error in the recording of lifetime fertility is caused by the failure of the enumerator to record responses of ‘zero’ on the census form, leaving the relevant space blank instead. It is impossible to be sure whether a blank means that the enumerator omitted to ask the question or record the response or whether it indicates zero. This error is usually more common in the data on younger women, who are more likely to be childless or answer zero to some of the six questions above. The error in some cases occurs because the enumerator assumes that the question is not relevant for younger women, or feels uncomfortable about asking it. A specific adjustment to the data, the el-Badry correction, is often indicated in this case. However, if in every age group the number of women with unstated parity is low (as a guide, less than 2 per cent of the total), then this reporting error is unlikely to have a material impact on the derived average parities and these cases can be ignored in further calculations. This is the same as making the explicit assumption that women with unstated parity have the same average parity as women in the same age group whose parity is known.
Proportions of women childless
The proportions of women who are childless should be calculated by age group of mother. The proportions should decline sharply with age. In most cases there should be around 3-10 per cent of women remaining childless in the oldest age-group, reflecting underlying levels of primary sterility and voluntary childlessness. In low fertility countries the proportion of childless women aged 45-49 may be even higher. Proportions of childless at older ages that exceed 10 per cent should be investigated further, as this may indicate significant errors in the data.
Average parities
A key indication of the consistency of data on women’s lifetime fertility is a credible pattern of average numbers of children alive and dead by age group of mother. In general, one would expect average parities (the average total number of co-resident, absent and dead children born to women) to increase steadily with age. The shape of the distribution by age should be sigmoid, with slightly flatter sections at the beginning and end, reflecting lower fertility at the youngest and oldest ages at which women bear children. Significant parity increments in these age groups – that is, large increases in average parities between successive age groups – are unlikely.
One would also expect average numbers of living children, dead children and the proportion of children dead each to rise with age.
A second check is to compare the observed average parities with results from Demographic and Health Surveys (DHS), or from earlier censuses and other surveys. In this regard, one can compare the average parities for real birth cohorts of women. Thus if two censuses are conducted a decade apart, the average parities of women aged x to x+4 in the earlier census can be compared with those of women aged x+10 to x+14 in the second. Average parities should not only increase monotonically with age within each census, but the cohorts should also show a reasonable parity increment between censuses.
If one has data on women aged 50 and over, one can make direct comparisons of the consistency of the average parities of women who have completed their childbearing – for example, by comparing the average parities of women aged 45-49 in one census with those of women aged 55-59 in a second census conducted a decade later. In making comparisons of this sort, and especially with comparisons involving older women, one should be alert to the possibility that mortality might differ according to the number of children a woman has had, either directly or because high fertility and socio-economic status may be correlated. This may hinder the ability to draw definitive conclusions about the trend in lifetime fertility.
A further refinement suggested by Feeney (1991) that is possible where there is information on the average parities of women who have completed their childbearing, is to locate these parities approximately in time and plot them. The approximate time location is derived by assuming that the average parities refer to a point time defined by subtracting the mid-point of each age group from the census date and assuming that all births in each cohort occurred at some mean age of childbearing, m. Thus, assuming m = 27.5 for example, if a census was conducted in 1960, the average parities of women aged 50-54 would refer (approximately) to 1960 - 52.5 + 27.5, or 1935.
The average parity of women of a given age x, Px, is calculated by dividing the total number of children ever born to women aged x at the census date by the number of women aged x at the census:
where Nx,j is the number of women aged x and of parity j in the population, and omega (ω) is the upper limit of the parities recorded in the population after excluding numerical values assigned as error codes in the data. In five-year age groups, the average parity of women in each age group is given by
for x=15, 20, … , 45.
For ease of exposition of many methods, average parities in five-year age groups, 15-19, 20-24, … are often indexed as P(i), i=1, 2 … , where P(1) refers to the 15-19 age group, P(2) the 20-24 age group etc.
Comparison with other estimates of average parities
Where other fertility data are available for the same country at a roughly similar point in time, the estimates should be compared. Where the estimates diverge to any great degree, efforts should be made to understand why this might be the case, although it will often be impossible to conclude definitively which of the data sets is deficient.
Comparison with total fertility
As a final check, the average parity for the 45-49 age group should be compared with the estimated total fertility (TF) derived from the data on recent fertility. If fertility has been constant for a long time, and the data were accurately reported, the two measures should be very close since period and cohort fertility would be equal under these conditions. If fertility has been falling, the average parity of older women should be greater than TF. As errors of underreporting of recent fertility will artificially depress TF, while omission of older women’s births will artificially depress the average parity in that group, it is important to ensure that both measures are plausible. One method of doing this uses the relational Gompertz model to examine the fertility and parity distributions and their implied relationship.
Example: Assessment of data on lifetime fertility
The example below uses the data from the 2008 Census of Cambodia distributed by IPUMS. The data (weighted, to compensate for the fact that the IPUMS data represent only a microsample of the full data) are presented in Table 1.
Table 1 Total children ever born by age group of mother, Cambodia, 2008 Census
|
|
Age group of mother |
|||||||
|
Parity |
15-19 |
20-24 |
25-29 |
30-34 |
35-39 |
40-44 |
45-49 |
Total |
|
0 |
743,190 |
426,760 |
191,720 |
58,530 |
46,650 |
36,050 |
28,780 |
1,531,680 |
|
1 |
29,560 |
167,810 |
142,720 |
44,310 |
34,530 |
25,790 |
21,740 |
466,460 |
|
2 |
4,240 |
78,410 |
171,450 |
90,990 |
79,080 |
51,980 |
36,680 |
512,830 |
|
3 |
1,200 |
16,940 |
82,960 |
84,220 |
98,640 |
67,690 |
48,190 |
399,840 |
|
4 |
830 |
4,020 |
26,870 |
48,510 |
79,480 |
70,400 |
56,190 |
286,300 |
|
5 |
430 |
1,340 |
6,910 |
21,010 |
49,250 |
56,980 |
51,500 |
187,420 |
|
6 |
270 |
630 |
2150 |
8,710 |
26,020 |
37,070 |
41,420 |
116,270 |
|
7 |
120 |
380 |
630 |
3,410 |
12,530 |
23,730 |
29,680 |
70,480 |
|
8 |
80 |
200 |
400 |
1,000 |
5,450 |
12,180 |
18,320 |
37,630 |
|
9 |
60 |
100 |
120 |
350 |
2410 |
6,030 |
10,040 |
19,110 |
|
10 |
40 |
120 |
140 |
190 |
1090 |
3,120 |
5,660 |
10,360 |
|
11 |
50 |
0 |
70 |
70 |
360 |
1,420 |
2,010 |
3,980 |
|
12 |
20 |
50 |
20 |
30 |
170 |
670 |
1,350 |
2,310 |
|
13 |
10 |
10 |
0 |
10 |
60 |
270 |
410 |
770 |
|
14 |
0 |
10 |
10 |
0 |
10 |
60 |
190 |
280 |
|
15 |
0 |
0 |
10 |
0 |
20 |
90 |
150 |
270 |
|
16 |
0 |
0 |
0 |
0 |
0 |
10 |
30 |
40 |
|
17 |
0 |
0 |
0 |
0 |
0 |
10 |
30 |
40 |
|
18 |
0 |
0 |
0 |
0 |
0 |
0 |
20 |
20 |
|
19 |
0 |
0 |
0 |
0 |
0 |
0 |
10 |
10 |
|
20 |
0 |
0 |
0 |
20 |
0 |
0 |
0 |
20 |
|
Unknown |
220 |
380 |
250 |
290 |
130 |
210 |
120 |
1,600 |
|
TOTAL |
780,320 |
697,160 |
626,430 |
361,650 |
435,880 |
393,760 |
352,520 |
3,647,720 |
The red italicized cell counts represent implausible parities according to the rule-of-thumb set out earlier. The values in these cells are summed and this total is added to the total number of women in each age group whose parity was missing in Table 1. The original values are then set to zero, resulting in the distribution shown in Table 2.
Table 2 Total children ever born by age group of mother after correcting for implausible parities, Cambodia, 2008 Census
| Age group of mother | ||||||||
| Parity |
15-19 |
20-24 |
25-29 |
30-34 |
35-39 |
40-44 |
45-49 |
Total |
|
0 |
743,190 |
426,760 |
191,720 |
58,530 |
46,650 |
36,050 |
28,780 |
1,531,680 |
|
1 |
29,560 |
167,810 |
142,720 |
44,310 |
34,530 |
25,790 |
21,740 |
466,460 |
|
2 |
4,240 |
78,410 |
171,450 |
90,990 |
79,080 |
51,980 |
36,680 |
512,830 |
|
3 |
1,200 |
16,940 |
82,960 |
84,220 |
98,640 |
67,690 |
48,190 |
399,840 |
|
4 |
830 |
4,020 |
26,870 |
48,510 |
79,480 |
70,400 |
56,190 |
286,300 |
|
5 |
430 |
1,340 |
6,910 |
21,010 |
49,250 |
56,980 |
51,500 |
187,420 |
|
6 |
0 |
630 |
2150 |
8,710 |
26,020 |
37,070 |
41,420 |
116,000 |
|
7 |
0 |
380 |
630 |
3,410 |
12,530 |
23,730 |
29,680 |
70,360 |
|
8 |
0 |
200 |
400 |
1,000 |
5,450 |
12,180 |
18,320 |
37,550 |
|
9 |
0 |
0 |
120 |
350 |
2410 |
6,030 |
10,040 |
18,950 |
|
10 |
0 |
0 |
140 |
190 |
1090 |
3,120 |
5,660 |
10,200 |
|
11 |
0 |
0 |
70 |
70 |
360 |
1,420 |
2,010 |
3,930 |
|
12 |
0 |
0 |
20 |
30 |
170 |
670 |
1,350 |
2,240 |
|
13 |
0 |
0 |
0 |
10 |
60 |
270 |
410 |
750 |
|
14 |
0 |
0 |
0 |
0 |
10 |
60 |
190 |
260 |
|
15 |
0 |
0 |
0 |
0 |
20 |
90 |
150 |
260 |
|
16 |
0 |
0 |
0 |
0 |
0 |
10 |
30 |
40 |
|
17 |
0 |
0 |
0 |
0 |
0 |
10 |
30 |
40 |
|
18 |
0 |
0 |
0 |
0 |
0 |
0 |
20 |
20 |
|
19 |
0 |
0 |
0 |
0 |
0 |
0 |
10 |
10 |
|
20 |
0 |
0 |
0 |
0 |
0 |
0 |
0 |
0 |
|
Unknown |
870 |
670 |
270 |
310 |
130 |
210 |
120 |
2,580 |
|
TOTAL |
780,320 |
697,160 |
626,430 |
361,650 |
435,880 |
393,760 |
352,520 |
3,647,720 |
|
Proportion missing |
0.111% |
0.096% |
0.043% |
0.086% |
0.030% |
0.053% |
0.034% |
|
|
Proportion childless |
95.24% |
61.21% |
30.61% |
16.18% |
10.70% |
9.16% |
8.16% |
|
|
Average parities |
0.0604 |
0.5833 |
1.4382 |
2.4035 |
3.1670 |
3.8126 |
4.3184 |
|
The proportion of women whose parity is unknown after making this adjustment is shown in the third last row of Table 2. In every age group, the proportion of women for whom parity data are missing is trivial. Although the proportion is somewhat higher in younger than in older age groups, even in the 15-19 age group only 0.11 per cent of women’s parities are unknown or implausible. An el-Badry correction is therefore unnecessary and the unknown cases can be excluded from the calculation of average parities, thereby implicitly assuming that women with implausible or missing data have the same average parities as other women of the same age. (The data presented here were chosen because an el-Badry correction is not required. The section of the manual dealing with the el-Badry correction presents data from another country whose parity data are not of as good quality.)
The proportion of women reported to be childless, shown in the second last line of Table 2, declines rapidly with age: by age 40, less than 10 per cent of women are still childless. As expected, this proportion falls only slightly further between the last two age groups: not many women start their childbearing after age 40. The proportion of women aged 45-49 who are childless (8.2 per cent) is relatively high. The average parities suggest very low levels of fertility in teenage girls, with lifetime fertility increasing to 4.3 children per woman in the 45-49 age group. A plot of the average parities has a sigmoid shape, with the largest parity increments occurring to women in their 20s and early 30s, the ages where fertility is expected to be highest (Figure 1).
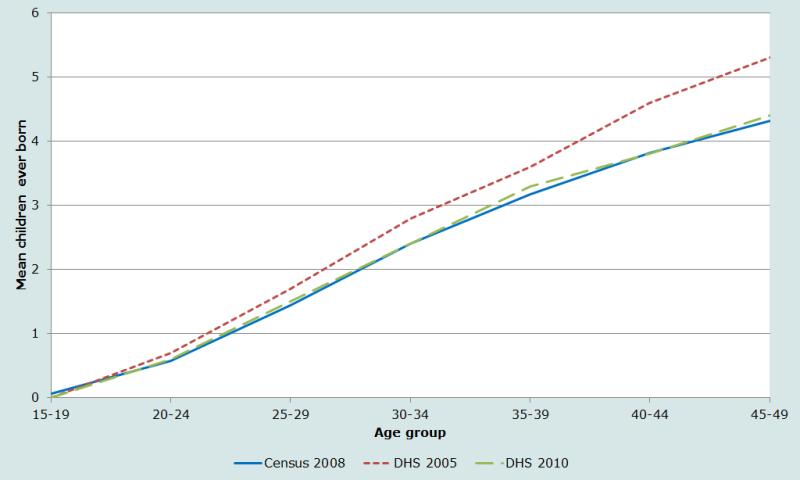
Figure 1 also shows the average parities by age group according to the 2005 and 2010 Cambodian Demographic and Health Surveys (available from the www.statcompiler.com DHS website). The average parities reported in the census and the 2010 survey are very similar. However, two features suggest one should be wary of concluding that this implies that they are accurate. First, given the timing of the three enquiries, the data from the census should lie approximately half-way between the estimates from the two DHSs. This is not the case. Second, it can be seen that the average parity of women aged 40-44 in the 2005 DHS is a little higher (by 0.2 of a child) than that of women aged 45-49 in the 2010 DHS. While fertility is low among women in their late 40s in Cambodia, and random error cannot be discounted, this result should encourage a little scepticism about the data. However, overall, the average parities from the two DHSs are not fundamentally at odds with those indicated by the 2008 census.
References
Feeney G. 1991. "Child survivorship estimation: Methods and data analysis", Asian and Pacific Population Forum 5(2-3):51-55, 76-87. https://hdl.handle.net/10125/3600.
- Printer-friendly version
- Log in to post comments