Evaluation of fertility data
Introduction
The fertility data collected in censuses seeks information both about recent births, and about lifetime fertility. In the 1960s, Brass and colleagues observed that these data each tended to subject to specific errors. The data on recent fertility was argued to suffer from systematic under-reporting; women’s reported births in the last year were believed to be uniformly under-reported by age of mother; the consequence of a combination of reference period errors (generally, condensing the reference period of the interval asked) and omission of neonatal deaths. Of course, other errors (for example, misattribution of adopted children to foster, rather than biological, mothers) might cause recent fertility to be overstated, although this is unlikely to have a material impact. Even in situations of high neonatal mortality, adoption and fostering effects are unlikely to be significant in the (generally) short reference period of the current fertility question(s).
By contrast, questions on lifetime fertility are also believed to suffer from underreporting, but here the effect is not independent of age, and is believed to worse with increasing age. The reasons advanced for this relate to omission of dead children, and older children who have left home.
This section describes the essential investigations to be pursued in the evaluation and assessment of fertility data collected in a census.
Data on recent fertility
The evaluation of recent fertility data has to consider two particular aspects. The first is the general observation (described above) that one anticipates that reports of recent fertility will be understated; the second is the precise framing of the questions used to determine recent births. Over successive waves of censuses, and in different countries, widely different questions have been used. The analyst, therefore, is enjoined to ascertain the precise wording of the questions used to elicit information on recent fertility. Several types of question are frequently encountered. Generic forms of the questions may, for example, ask
- Have you given birth in the last year (or other reference period)?
This produces a simple binary answer. Multiple confinements in the same reference period are not captured; nor is the incidence of multiple deliveries from the same confinement (twins, triplets, etc.). Neither of these failings are hugely material; the probability of multiple confinements in the typical reference period of a year is very small, as is the probability of any confinement resulting in multiple deliveries – the incidence of such cases is of the order of 2 per cent of all confinements in most settings. When faced with data of this kind, it is recommended that the analyst makes the obvious (and necessary) assumptions that all births occurred halfway through the reference period, and that only one live birth resulted from each confinement.
- How many children have you given birth to in the last year (or other reference period)?
This question is more refined than the one above. While it still fails to capture information on the timing of birth within the reference period, it captures (but does not distinguish between) multiple confinements and multiple deliveries. Again, the reasonable assumption with data of this kind is that the births occurred halfway through the reference period. This question can also be asked of sons and daughters, separately.
- What was the date of your last live birth?
This question seeks to identify the timing of the last confinement with a greater degree of accuracy (typically, the question seeks information on only the month and year of the last birth). Additional questions may seek further information on whether there were multiple deliveries from that confinement and/or on the sex of that (those) delivery(ies). Faced with data of this form, the timing of births can be estimated with a high degree of accuracy, while the inclusion of follow-up questions on the number of births at that confinement also gives more accurate information on recent births.
Additional questions (for example, on the vital status of the last born child; or sex of last born child) are occasionally encountered. Answers to such questions can be used to estimate child mortality rates, or a sex ratio at birth directly from the data.
In evaluating the quality of data on recent fertility, the following checks might be conducted:
- Comparison of total number of births with that expected, or with numbers from a vital registration system;
- Plausibility checks of the resulting fertility distribution based on direct calculation from the data (described below);
- Plausibility checks on the reported numbers of births in the reference period – in some censuses (e.g. South Africa 1996), a significant proportion of respondents evidently confused the questions on lifetime and recent fertility, and gave the same answers to both questions. This error was manifest in a strong diagonal in tabulations of children ever born by children born in the last year by age of mother (Moultrie and Timæus 2002);
- Where data on the sex of the last born child is collected, a plausibility and integrity check of the implied sex ratio at birth is recommended.
In all cases, care must be taken to correctly identify the universe of women required to answer the questions (in particular the ages and marital status of legitimate respondents), as well as the rules governing recording and coding of non-response and incorrect data.
Direct measurement of fertility
Direct measurement of fertility from census data is required for two somewhat different purposes. First, if the data are of sufficiently high quality, the exercise is an end in itself; to provide estimates of age-specific fertility rates. However, if the data are of inferior quality, the age-specific fertility rates from the direct calculation are required as inputs into many methods that aim to produce more reliable estimates of the level of fertility from limited, deficient or defective data.
The exact form of the age-specific fertility rates that can be derived hinges centrally on the data available to the user. In its simplest form, an age-specific fertility rate at any given age (or in any age group) is the ratio of the number of births to women of that age/age-group in a defined period (typically a year in the case of census data) to the number of person years lived by women of that age/age-group in that period. However, to calculate age-specific fertility rates exactly, one would need to know reliably the exact dates of birth of mothers and their children, as well as the census enumeration date. If this was the case, one would be able to calculate precisely, the age of the mother at the birth of her child, as well as allocate her exposure to risk to the relevant ages or age groups over the period of investigation.
However, the data required for such entirely precise calculations are not usually routinely disseminated with census microdata records (for fear of breaching confidentiality if full dates of birth are revealed) but also typically the data are of insufficient quality to warrant the additional precision. Heaping of months of birth (e.g. on January) as well as years of birth (e.g. those ending in 0 or 5) are commonly encountered problems with the data, while extended census enumeration periods can induce significant reference period errors. Without any significant loss of generality, four possible combinations of reporting of mother’s vital information, and that of recent fertility are typically encountered. Each results in slightly different metrics of fertility with slightly different interpretations.
|
|
|
Mothers’ vital information |
|
|
|
|
Age in completed years at census |
Date of birth |
|
Reporting of children born in the preceding period(a) |
Number of
children born |
(1) |
(2) |
|
Date of birth
of last born child |
(3) |
(4) |
|
a. Typically this is 12 months, but users should be alert to non-standard reference periods – the 1986 Swaziland Census, for example, makes use of time since the preceding Reed Dance, with concomitant reference period errors being possible
While a description is offered below as to how to proceed with the precise calculation of the exposure to risk, and hence exact measures of fertility, simpler approximations to the measurement of fertility are generally called for. In all cases other than the fourth (and even there, only under specific conditions), expending effort to estimate accurately the exposure to risk for the purposes of estimating fertility is not warranted, as heaping of dates on particular months, and the often poor quality of data will mean that that the estimates resulting may be badly distorted.
Estimation of age-specific fertility rates directly from the data where there is no information on the timing of the child’s birth
In the first two cases identified in the table above, all that might be known about the mother’s recent fertility is whether or not she gave birth to at least one child in the period before the census; in more informative variants of the recent fertility question, the mother may be asked about the number of live births in the period preceding the census. Such a question allows the identification both of multiple births from the same parturition (twins, triplets etc.), as well as instances of more than one parturition in the defined period, although both these situations are comparatively rare, and the impact on the estimated fertility rates of knowing only whether the mother gave birth in the preceding period is essentially trivial.
The approximation thus used is to tabulate the fertility rates by the reported age of the mother at the census date, not her age at the birth of her child, and then making the additional assumption that all children born were born half way through the interval in question. This means that mothers are, on average, older by the same amount at the time of the census, with the implication that the ages to which the fertility rates actually refer are exaggerated accordingly. In any event, most standard methods of estimating fertility from a single census can compensate automatically for the displacement of ages arising from the slightly incorrect direct calculation of fertility rates.
The additional information available in Scenario (2) on mother’s month and year of birth is not particularly helpful in accurately measuring fertility rates, since additional assumptions of uniformity of the distribution of both births, as well as mothers’ birthdays are required.
To derive fertility rates in this situation, the number of women, by age at the census date, is taken as the denominator, while the count of children reported born in the reference period, by age of mother at the census date, is taken as the numerator.
Before proceeding with the derivation of age-specific fertility rates, it is advisable to perform the following investigations, in addition to those of the age- and sex-distribution of the data described elsewhere: First, investigate the extent to which data on recent births is either missing or implausible. The absence of any missing data is a very strong indication that the data have been edited. If this is suspected, further investigations into the extent of editing and/or imputation of the data is recommended where this is possible. This may involve looking at the distribution of imputed values from imputation flags. Next, estimate the proportion of the data that is missing. If this is in excess of five per cent of the total number of records in the universe giving rise to the current fertility data, investigate further (for example, by examining the age distribution of missing cases – a concentration among very young or very old women would tend to lead to an assessment that the missing cases are missing because these mothers did not have a birth in the reference period, and this was omitted by the enumerator rather than recorded as zero – an error very similar to that giving rise the el-Badry correction).
Second, where data are tabulated by the number of births in the reference period (as opposed to simply whether a birth occurred in the reference period or not), examine the distribution of single vs multiple confinements. The incidence of twin births from the same confinement is rare – typically around two to four per cent of maternities (not the same as the proportion of deliveries that are twins or triplets in most human populations). Triplets and higher order multiple births are exceedingly rare (much less than 1 per cent of deliveries). If the proportion of multiple births in the reference period seems to high, it is recommended that tabulations of children ever born and births in the last year are produced for each age group of women: if there is a strong diagonal effect at higher parities (it is quite possible that a large proportion of younger women with only one child ever born gave birth to that child in the reference period), with children ever born and births in the last year being equal in a large proportion of cases, this may suggest that respondents or enumerators did not understand the distinction between the questions on lifetime, and recent, fertility.
The total number of births in the reference period reported by women aged at the census date, Bx, is given by
where k is the reported number of births in the reference period, ω is the maximum value of k in the data and Nx,k is the number of women aged x at the census reporting k births in the last year. If ω is classified as an open interval, e.g. 3+ births in the reference period, women in that category are all assumed to have had the number of births that opens that interval.
The number of women aged x is given by
Women whose recent births are unknown or unrecorded are ignored from both the numerator and denominator, with the implicit assumption that their fertility is no different from those of women whose recent fertility is known. Age-specific fertility rates at age x are therefore given by
Using the conventional age range of [15,50) as the limits for the summation. The implied Total Fertility Rate (TFR) from the single-age data is given by
Fertility rates by single-years of age should be calculated and graphed as an important check on the internal coherence of the data. ASFRs will tend to exhibit a greater degree of stability than either the numerators or the denominators on their own, and may indicate plausible and sensible levels and distributions of fertility. A highly erratic series of age-specific fertility rates by age, departing markedly from the anticipated n-shape, offers a strong indication that the recent fertility data are problematic, and suggests that further investigations are required.
Finally, age-specific fertility rates in 5-year bands, i= 1….7, where i=1 corresponds to the 15-19 age group; i=2 to the 20-24 etc. can be derived:
with its commensurate TFR,
Note that while the TFR is an age-standardised measure of fertility (implicitly assuming a uniform distribution of the population of child-bearing population of women by age in each age group) the ASFR of a group is not age standardized within the group. As a result, the TFRs derived by age-group and by single-years of age will differ to a small degree, typically in the second or third decimal place.
An essential check is that the TFR should be compared and contrasted with that from other data sources from the same country (e.g. a DHS) to get a first impression of the likely reliability of the data. However, it is worth reiterating that the ASFRs and TFRs produced using this method are not correct in any strict sense since the exposure-to-risk has not been taken into account in the derivation of the denominators, while the numerator tabulates the events that took place during the reference period by the age of the mother at the end of the reference period, not her age at the time the event took place. Most methods of indirect fertility estimation can adjust the derived fertility rates for the shift and can present estimates of the fertility rates in conventional groups.
Estimation of age-specific fertility rates where there is information on the timing of the child’s birth
Where births are classified by the date of last birth, a suitable period needs to be chosen for the fertility investigation. In general, it is a poor idea to use a period of much longer than a year: a longer period of investigation raises the probability that women might have had more than a single confinement in that period, resulting in births earlier in time not being recorded (the requirement being to report on the date of birth of the last child, not all children in the period), meaning that estimates of fertility will systematically omit births in the more distant past. In addition, if fertility has been changing rapidly, extending the period of investigation over more than a year or so means that the estimates of fertility so derived will represent some kind of average of fertility over the period.
The third scenario also does not permit the derivation of a completely accurate measure of fertility, as the age of the mother at the birth of the child cannot be established precisely. However, knowledge of the child’s date of birth does permit the numerator of the age-specific fertility rates to be more carefully derived.
In the commonly-encountered situation where the question asked is about the month and year of the last child’s birth, a more careful approach can be taken to determining the number of births in the last year. Usually a notional census date as defined (the questions on the census form typically refer to a particular day, even if the actual process of enumeration takes several weeks: a list of census dates for the last three rounds of censuses is maintained by the UN here; a list of census dates in data maintained by IPUMS is available here).
It is recommended that in establishing the numerator (leaving aside for the moment the determination of the age definition of the mothers reporting births) include all the births reported in the month of the census, and a prorated proportion of births that are reported to have occurred in the equivalent month a year earlier. To extract this information, it is usually easiest to make use of the Century-Month Code (CMC) system used by the DHS.
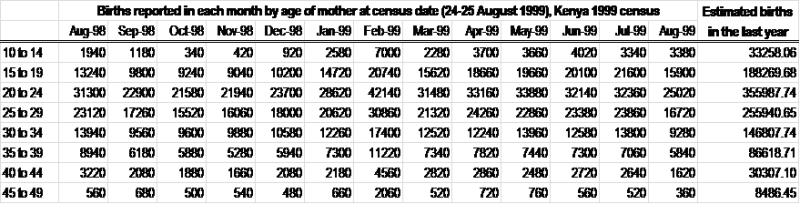
For example, in the Kenya 1999 census, the official census date was the night of 24-25 August 1999. To estimate the births that occurred in the year preceding the census, all births reported between September 1998 and August 1999 would be included, along with 1-24/31 (=7/31) of the births reported in August 1998, on the assumption that births are uniformly distributed over the days of a month.
Note that, in the absence of further information about the mother’s date of birth, the data above is still tabulated according to the mother’s age at the census date, and the rates so derived would still be subject to a half-year shift, as with the other methods described above.
Only the fourth case, when detailed information is available on both mother and child’s date of birth, is it possible to produce a precise measurement of fertility. However, if there is evidence of extreme heaping of reported dates of birth (for example on 1 January), there is little utility in making use of the more complex measures as they will be distorted by the heaping. Thus, since the quality and internal consistency of the data collected in a census is unlikely to be as good as that in a DHS, it is somewhat spurious to attempt such an exercise as is done with the calculation of fertility rates in a DHS.
Example
In the 2008 Cambodian census, women were asked about the number of children given birth to in the previous year. Mother’s age was classified by age at the census date. The data are shown below.
|
|
Births in the last year |
|
|
||||||
|
Age |
0 |
1 |
2 |
3 |
4 |
5 |
Unknown |
Births |
Women |
|
15 |
301400 |
480 |
130 |
0 |
0 |
0 |
80 |
740 |
302010 |
|
16 |
299730 |
1450 |
0 |
10 |
0 |
0 |
50 |
1480 |
301190 |
|
17 |
286410 |
3890 |
30 |
10 |
0 |
0 |
20 |
3980 |
290340 |
|
18 |
325800 |
9370 |
40 |
0 |
0 |
0 |
40 |
9450 |
335210 |
|
19 |
217270 |
11810 |
30 |
0 |
0 |
0 |
30 |
11870 |
229110 |
|
20 |
230660 |
18030 |
210 |
0 |
0 |
0 |
90 |
18450 |
248900 |
|
21 |
183180 |
18200 |
160 |
0 |
0 |
0 |
70 |
18520 |
201540 |
|
22 |
189230 |
21060 |
310 |
0 |
0 |
0 |
30 |
21680 |
210600 |
|
23 |
190660 |
23920 |
250 |
10 |
0 |
0 |
110 |
24450 |
214840 |
|
24 |
187440 |
24240 |
430 |
10 |
20 |
0 |
80 |
25210 |
212140 |
|
25 |
228120 |
29090 |
470 |
0 |
0 |
0 |
60 |
30030 |
257680 |
|
26 |
186180 |
25610 |
470 |
20 |
0 |
0 |
80 |
26610 |
212280 |
|
27 |
192970 |
26860 |
570 |
20 |
10 |
0 |
40 |
28100 |
220430 |
|
28 |
197770 |
26180 |
640 |
20 |
10 |
0 |
30 |
27560 |
224620 |
|
29 |
147920 |
20850 |
530 |
10 |
0 |
0 |
40 |
21940 |
169310 |
|
30 |
163270 |
21730 |
600 |
40 |
0 |
0 |
30 |
23050 |
185640 |
|
31 |
124180 |
16790 |
550 |
60 |
0 |
0 |
30 |
18070 |
141580 |
|
32 |
138700 |
16030 |
600 |
50 |
10 |
0 |
110 |
17420 |
155390 |
|
33 |
134320 |
15750 |
450 |
20 |
0 |
20 |
50 |
16710 |
150560 |
|
34 |
128030 |
13250 |
250 |
10 |
20 |
0 |
70 |
13860 |
141560 |
|
35 |
169810 |
15420 |
450 |
60 |
10 |
0 |
30 |
16540 |
185750 |
|
36 |
141900 |
12530 |
320 |
50 |
0 |
0 |
30 |
13320 |
154800 |
|
37 |
144720 |
11490 |
320 |
20 |
10 |
10 |
10 |
12230 |
156570 |
|
38 |
162180 |
11660 |
480 |
60 |
30 |
10 |
30 |
12920 |
174420 |
|
39 |
127490 |
8370 |
280 |
20 |
0 |
0 |
30 |
8990 |
136160 |
|
40 |
158650 |
8530 |
390 |
50 |
10 |
0 |
50 |
9500 |
167630 |
|
41 |
120990 |
5850 |
180 |
40 |
10 |
0 |
20 |
6370 |
127070 |
|
42 |
140080 |
5610 |
210 |
50 |
0 |
0 |
60 |
6180 |
145950 |
|
43 |
125480 |
3910 |
170 |
40 |
0 |
0 |
30 |
4370 |
129600 |
|
44 |
117700 |
2560 |
60 |
60 |
0 |
0 |
50 |
2860 |
120380 |
|
45 |
144780 |
2480 |
170 |
30 |
10 |
0 |
30 |
2950 |
147470 |
|
46 |
110320 |
1610 |
30 |
130 |
30 |
0 |
40 |
2180 |
112120 |
|
47 |
111840 |
1030 |
60 |
40 |
10 |
0 |
0 |
1310 |
112980 |
|
48 |
124860 |
940 |
40 |
70 |
10 |
0 |
30 |
1270 |
125920 |
|
49 |
93130 |
610 |
30 |
30 |
10 |
0 |
20 |
800 |
93810 |
|
|
|
|
|
|
|
|
|
|
|
|
TOTAL |
6047170 |
437190 |
9910 |
1040 |
210 |
40 |
1600 |
461170 |
6497160 |
1600 women, out of nearly 6.5 million aged 15-49, did not have their recent fertility recorded. This represents 0.025% of all women, and can safely be regarded as having no material impact on the estimated fertility of women in Cambodia. (A further check on the age distribution of these cases shows no clear age pattern, too). On the basis that multiple confinements in the same year is exceedingly unlikely, the number of confinements is given by the sum of women reporting 1, 2, 3 … 5+ deliveries, in the last row. In the 2008 Cambodian data, this is a total of 448390 confinements. Of these, 97.5 per cent (437 190 / 448 390) resulted in a single delivery. 2.2 per cent resulted in twins, and 0.3 per cent in triplets or higher-order multiple deliveries. Again, even though the possibility of quintuplets (or five births in two confinements over the period) is remote, the small proportion of such confinements will not have a material impact on the estimates derived.
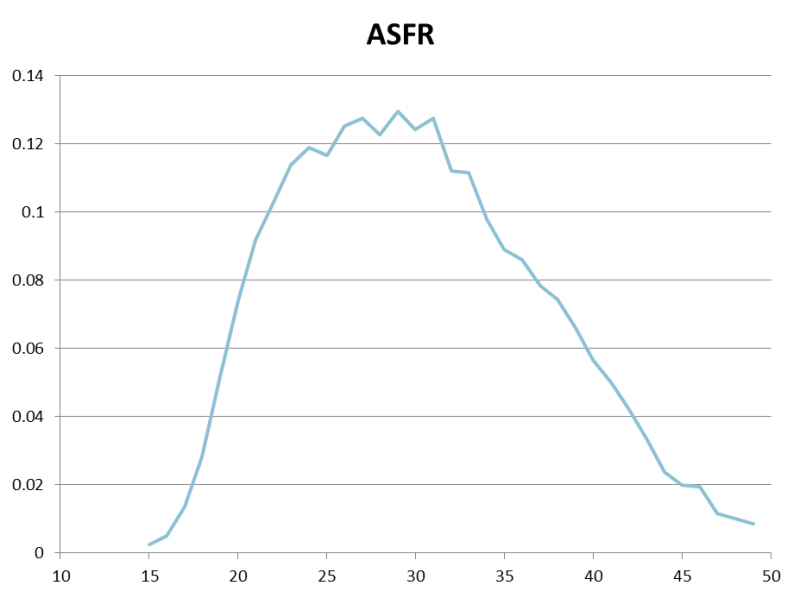
Using the data above, the following series of single-age ASFRs is derived. Note that the fertility rates, even by single years of age, are relatively smooth, with a clearly defined typical fertility pattern, even though the number of women enumerated at each age is far more erratic.
The TFR implied by these data is 2.47 children per woman. Summing births and women in five year age groups results gives the same answer, although as suggested above, the measures do differ in the third decimal place:
|
|
Women |
Births |
ASFR |
|
15-19 |
1458080 |
27520 |
0.019 |
|
20-24 |
1088400 |
108310 |
0.100 |
|
25-29 |
1084570 |
134240 |
0.124 |
|
30-34 |
775020 |
89210 |
0.115 |
|
35-39 |
807830 |
64100 |
0.079 |
|
40-44 |
690840 |
29280 |
0.042 |
|
45-49 |
592420 |
8510 |
0.014 |
|
TFR |
|
2.47 |
Data on lifetime fertility
The second class of question on fertility asked in censuses concerns women’s lifetime fertility. As a possible means of reducing the systematic underreporting of lifetime fertility (often, of dead or absent children, and particularly by older women), the questions are typically structure as a series of six questions about
- The number of sons and daughters (asked separately) born alive, and living with the mother
- The number of sons and daughters (asked separately) born alive, but living elsewhere
- The number of sons and daughters (asked separately) born alive, but now deceased
The total of the answers to the questions relating to living children, present and absent, provides the total number of children born and surviving; adding the reported numbers of children dead gives the total number of children ever born to the woman. When summing these individual answers, care must be taken not to treat error or missing value codes as legitimate responses. For example, if a missing value is coded as ‘9,’ the process of deriving measures of the total children ever born, surviving and dead must make sure to exclude these codes.
It is not uncommon for the total number of children ever born to be truncated at some relatively high number (e.g. 11+). When this is the case, the only plausible assumption is that women in that category have had the lower bound’s number of children. The resulting errors are generally small, except in the case of extremely high fertility and, even then, only at the oldest ages.
In evaluating the quality of data on lifetime fertility, the analyst should be alert to improbable and implausible parities by age of mother. A useful, and not too exacting, rule of thumb is to assume that a woman can have a maximum of one birth every 18 months from the age of 12, and rounding down to the next integer. On this rubric, by exact age 20 (the end point of the 15-19 age group), a woman might have had a maximum of 5 children; by exact age 25 (closing the 20-24 age group), 8. Where reported number of lifetime births exceed this maximum, they should be recoded as missing to maintain the integrity of the data and sample size.
Another common error in the recording of lifetime fertility is caused by the failure of the enumerator to record responses of ‘zero’ on the census form. This error is more significant among younger women, who are more likely to be childless, or answer zero to some of the six questions above. A specific adjustment to the data, the el-Badry correction, is often indicated in this case. The el-Badry correction is described later in this document. However, if the number of women with unstated parity is low, not concentrated amongst the youngest women, and is unlikely to have a material impact on the derived average parities, then these cases can safely be ignored in further calculations, which is the same as making the explicit assumption that women with unstated parity are no different from those women whose parity is known. (Note that this is a different treatment of the unknown cases from when a substantial proportion of women’s parities are unknown but the el-Badry correction cannot be applied; in that case, the unknown parities are all treated as if the mothers were childless).
Third, the proportions of women who are childless should be calculated by age group of mother. We would expect the proportions childless to decline sharply with age, with around 5-10 per cent of women remaining childless in the oldest age-group. In developed, or low fertility, countries the proportion of childless women aged 45-49 may be higher.
The fundamental check on women’s lifetime fertility is to derive the average numbers of children alive and dead by age group of mother. Internally, we would expect average parities (the average number of children born to women) to increase monotonically with age. The shape of the distribution by age should be sigmoidal, reflecting low fertility at oldest and youngest ages. Significant parity increments in these age groups – that is, the increase in average parities from one age group to another – is unlikely. A more robust check is to compare the average parities against the results from (for example) Demography and Health Surveys, or from earlier censuses and other surveys.
In this regard, one can compare the average parities for synthetic cohorts of women: if two censuses are conducted a decade apart, the average parities of women aged [x,x+5) in the earlier census can be compared with those of women aged [x+10, x+15) in the second. Again, average parities should increase monotonically with age, and show a reasonable parity increment as well.
Finally, the average parity for the oldest age group should be compared with the TFR derived earlier. If fertility has been constant for a long time, and the data perfectly reported, the two measures should be very close. If fertility has been falling, the cohort fertility of older women should be greater than the TFR. Of course, when making this assessment, errors of underreporting of recent fertility will artificially depress the TFR, while omission of older women’s births will artificially depress the cohort fertility rate in that group. Thus before using this comparison to determine the nature and magnitude of a fertility decline, care must be taken to ensure that both measures are plausible. One measure of doing this is to apply the Brass P/F or Relational Gompertz model methods of indirect fertility estimation.
Example
The example below again draws on the data from the 2008 Cambodian census. The data (weighted) as downloaded from IPUMS are as below.
|
15-19 |
20-24 |
25-29 |
30-34 |
35-39 |
40-44 |
45-49 |
Total |
|
|
0 |
1379130 |
627380 |
297070 |
113830 |
80550 |
59020 |
45210 |
2602190 |
|
1 |
59900 |
262620 |
222290 |
83090 |
55680 |
42360 |
35200 |
761140 |
|
2 |
10220 |
140990 |
285090 |
157740 |
112400 |
73900 |
53900 |
834240 |
|
3 |
2850 |
38620 |
171710 |
159880 |
144320 |
95440 |
68440 |
681260 |
|
4 |
2030 |
10910 |
71350 |
120880 |
135580 |
105850 |
80720 |
527320 |
|
5 |
1060 |
3400 |
23490 |
72610 |
106300 |
96080 |
78160 |
381100 |
|
6 |
870 |
1750 |
7780 |
38960 |
76980 |
76250 |
68960 |
271550 |
|
7 |
640 |
890 |
2740 |
16800 |
48310 |
56920 |
55530 |
181830 |
|
8 |
370 |
680 |
1470 |
6970 |
26030 |
37100 |
41500 |
114120 |
|
9 |
320 |
320 |
560 |
2170 |
12000 |
21890 |
26170 |
63430 |
|
10 |
210 |
290 |
380 |
1070 |
5930 |
13540 |
18450 |
39870 |
|
11 |
90 |
50 |
190 |
390 |
2120 |
5850 |
8680 |
17370 |
|
12 |
130 |
80 |
100 |
180 |
930 |
3890 |
6700 |
12010 |
|
13 |
40 |
20 |
40 |
70 |
310 |
1260 |
2370 |
4110 |
|
14 |
0 |
20 |
40 |
40 |
180 |
680 |
1210 |
2170 |
|
15 |
0 |
0 |
20 |
10 |
30 |
340 |
660 |
1060 |
|
16 |
0 |
0 |
0 |
10 |
30 |
140 |
260 |
440 |
|
17 |
0 |
0 |
0 |
0 |
10 |
50 |
110 |
170 |
|
18 |
0 |
0 |
0 |
10 |
10 |
30 |
50 |
100 |
|
19 |
0 |
0 |
0 |
0 |
0 |
30 |
10 |
40 |
|
20 |
0 |
0 |
0 |
20 |
0 |
10 |
10 |
40 |
|
Unknown |
220 |
380 |
250 |
290 |
130 |
210 |
120 |
1600 |
|
TOTAL |
1458080 |
1088400 |
1084570 |
775020 |
807830 |
690840 |
592420 |
6497160 |
The cells marked in red are implausible parities using the rule-of-thumb set out earlier. These are then treated as missing cases, as per the table below.
|
15-19 |
20-24 |
25-29 |
30-34 |
35-39 |
40-44 |
45-49 |
Total |
|
|
0 |
1379130 |
627380 |
297070 |
113830 |
80550 |
59020 |
45210 |
2602190 |
|
1 |
59900 |
262620 |
222290 |
83090 |
55680 |
42360 |
35200 |
761140 |
|
2 |
10220 |
140990 |
285090 |
157740 |
112400 |
73900 |
53900 |
834240 |
|
3 |
2850 |
38620 |
171710 |
159880 |
144320 |
95440 |
68440 |
681260 |
|
4 |
2030 |
10910 |
71350 |
120880 |
135580 |
105850 |
80720 |
527320 |
|
5 |
1060 |
3400 |
23490 |
72610 |
106300 |
96080 |
78160 |
381100 |
|
6 |
0 |
1750 |
7780 |
38960 |
76980 |
76250 |
68960 |
271550 |
|
7 |
0 |
890 |
2740 |
16800 |
48310 |
56920 |
55530 |
181830 |
|
8 |
0 |
680 |
1470 |
6970 |
26030 |
37100 |
41500 |
114120 |
|
9 |
0 |
0 |
560 |
2170 |
12000 |
21890 |
26170 |
63430 |
|
10 |
0 |
0 |
380 |
1070 |
5930 |
13540 |
18450 |
39870 |
|
11 |
0 |
0 |
190 |
390 |
2120 |
5850 |
8680 |
17370 |
|
12 |
0 |
0 |
100 |
180 |
930 |
3890 |
6700 |
12010 |
|
13 |
0 |
0 |
0 |
70 |
310 |
1260 |
2370 |
4110 |
|
14 |
0 |
0 |
0 |
40 |
180 |
680 |
1210 |
2170 |
|
15 |
0 |
0 |
0 |
10 |
30 |
340 |
660 |
1060 |
|
16 |
0 |
0 |
0 |
0 |
30 |
140 |
260 |
440 |
|
17 |
0 |
0 |
0 |
0 |
10 |
50 |
110 |
170 |
|
18 |
0 |
0 |
0 |
0 |
10 |
30 |
50 |
100 |
|
19 |
0 |
0 |
0 |
0 |
0 |
30 |
10 |
40 |
|
20 |
0 |
0 |
0 |
0 |
0 |
10 |
10 |
40 |
|
Unknown |
2890 |
380 |
250 |
290 |
130 |
210 |
120 |
1600 |
|
TOTAL |
1458080 |
1087620 |
1084470 |
774980 |
807830 |
690840 |
592420 |
6497160 |
|
Proportion missing |
0.198% |
0.035% |
0.023% |
0.037% |
0.016% |
0.030% |
0.020% |
|
|
Proportion childless |
94.59% |
57.68% |
27.39% |
14.69% |
9.97% |
8.54% |
7.63% |
|
|
Average parities |
0.07 |
0.68 |
1.66 |
2.80 |
3.72 |
4.36 |
4.82 |
After making the correction for implausible parities, we proceed to examine the proportion unknown. In every age group, the proportion of women for whom parity data is unknown is trivial. Even in the 15-19 age group, only 0.2% of women’s parities are unknown, even though relative to other age groups, the proportion unknown in this group is substantially higher than in other groups. This makes the performance of an el-Badry correction redundant, and the unknown cases can be excluded from the calculation of average parities.
The proportions childless decline rapidly, as expected, by age 35-39, less than 10 per cent of women are still childless, a proportion that falls only by a little amount by the last age group, which is to be expected: not many women have their first child after age 40. The proportion of women who are childless by age 45-49 (7.6%) is relatively high.
The average parities show very low levels of teenage fertility, with lifetime fertility increasing to just short of 5 children per women in the 45-49 age group. The average parities do show a sigmoidal shape with the largest parity increments occurring in the ages where fertility is expected to be highest. Note that, since an el-Badry correction has not been applied, the unknown cases are excluded from the denominator when estimating the average parities.
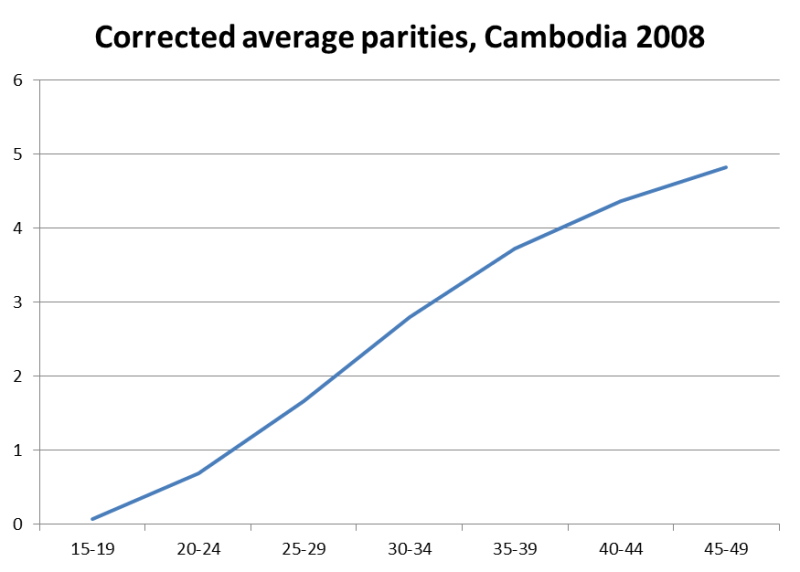
In comparison with the TFR derived earlier (2.5 children per woman), it would appear that a substantial fertility decline is in place. Whether this is so cannot be deduced solely from these data. While the average parities of older women do not seem unreasonable (but should be checked against other data sources), more importantly, the level of fertility appraised from the direct calculation needs to be assessed for its plausibility and reasonableness.
- Log in to post comments